Full Report
The numbers behind AT&T Inc.: as-reported financial statements and company metrics for FY2021–FY2025, traced to the source filings, opened with the share-price history those statements have to justify. Every linked figure opens the exact page of the filing it was printed on, with the statement row highlighted. Amounts in US$ millions unless noted.
Reading notes: Continuing-operations basis: AT T spun off WarnerMedia in April 2022 and the FY2022 Form 10-K reclassified it to discontinued operations. FY2021 and FY2022 figures shown here are the restated continuing-operations numbers taken from the FY2022/FY2023 10-Ks — so FY2021 total operating revenues are $134,038M, not the $168,864M originally reported in the FY2021 10-K. This keeps the five-year statements comparable. The FY2021 balance sheet still carries $119,776M of WarnerMedia 'Assets from discontinued operations' (held for sale at 12/31/2021), which inflates FY2021 total current assets ($170,768M) and total assets ($551,622M) relative to later years. FY2021 'Corporate and Other' segment revenue ($16,561M) includes legacy Video/DIRECTV and held-for-sale reclassifications and is therefore not comparable to the ~$0.4–0.5B reported in FY2022–FY2025. Cash-flow FY2021 and FY2022 are the 'from Continuing Operations' subtotals (they exclude discontinued WarnerMedia cash flows); FY2023–FY2025 are total company (no discontinued operations remaining).
Share Price — Full Available History — 37 Years
The stock closed at $22.96 on Jul 23, 2026 — up 895% over the window shown (+6.5% a year), trading between $1.69 and $33.74. At that close the stock trades at 7.6× FY2025 diluted EPS as reported below.
Source: market price feed, monthly closes, sampled from 9,207 source observations, Jan 1990–Jul 2026. Price return only, excludes dividends. Prices are split-adjusted (1:2 on May 26, 1993; 1:2 on Mar 20, 1998; ×1.324 on Apr 11, 2022).
Market capitalization $142.1bn.
Market cap = 6.19B shares outstanding × the Jul 23, 2026 close of $22.96. Market-derived, shown without filing links.
FY2025 at a Glance
Revenue (US$ millions)
Operating income (US$ millions)
Net income (US$ millions)
Diluted EPS
Source: FY2025 consolidated statements [1] [2]. Click any linked figure to open the filing page with the row highlighted.
Revenue by Operating Segment
| Revenue by Operating Segment | FY2021 | FY2022 | FY2023 | FY2024 | FY2025 |
|---|---|---|---|---|---|
| Mobility | 78,254 | 81,780 | 83,982 | 85,255 | 89,482 |
| Business Wireline | 23,937 | 22,538 | 20,883 | 18,819 | 17,231 |
| Consumer Wireline | 12,539 | 12,749 | 13,173 | 13,578 | 14,183 |
| Total Communications | 114,730 | 117,067 | 118,038 | 117,652 | 120,896 |
| Latin America | 2,747 | 3,144 | 3,932 | 4,232 | 4,379 |
| Corporate and Other | 16,561 | 530 | 458 | 452 | 373 |
| Total operating revenues | 134,038 | 120,741 | 122,428 | 122,336 | 125,648 |
| Total operating revenues growth, derived | — | -9.9% | +1.4% | -0.1% | +2.7% |
Source: Note — Segment Information (Communications: Mobility, Business Wireline, Consumer Wireline; Latin America; Corporate and Other) [3] [4] [1] [5]. Click any linked figure to open the filing page with the row highlighted.
Operating Income by Operating Segment
| Operating Income by Operating Segment | FY2021 | FY2022 | FY2023 | FY2024 | FY2025 |
|---|---|---|---|---|---|
| Mobility | 23,370 | 23,812 | 25,861 | 26,314 | 27,196 |
| Business Wireline | 4,027 | 2,290 | 1,289 | (88) | (816) |
| Consumer Wireline | 996 | 634 | 651 | 869 | 1,547 |
| Total Communications | 28,393 | 26,736 | 27,801 | 27,095 | 27,927 |
| Latin America | (510) | (326) | (141) | 40 | 145 |
| Corporate and Other | (1,986) | (30,997) | (4,199) | (8,086) | (3,910) |
| Operating Income | 25,897 | (4,587) | 23,461 | 19,049 | 24,162 |
Source: Note — Segment Information; segment operating income (loss) [3] [4] [1] [5]. Click any linked figure to open the filing page with the row highlighted.
Income Statement
Source: Consolidated Statements of Income (continuing operations basis from FY2022 10-K onward) [1] [2]. Click any linked figure to open the filing page with the row highlighted.
Columns marked E are consensus analyst estimates from S&P Capital IQ (CapIQ), shown alongside reported results for direct comparison; they are not company guidance.
Estimate source: S&P Capital IQ (CapIQ) consensus, as of 2026-07-24. Estimate figures are S&P Capital IQ consensus (vendor data — no filing page links). EPS and net income use the normalized (adjusted) consensus where the street reports it. Line-item analyst models (segments, drivers, KPIs) are in the Visible Alpha tab.
Balance Sheet
Source: Consolidated Balance Sheets [6] [7] [8]. Click any linked figure to open the filing page with the row highlighted.
Cash Flow
Source: Consolidated Statements of Cash Flows (continuing operations for FY2021–FY2022) [9] [10]. Click any linked figure to open the filing page with the row highlighted.
Mobility — Subscribers, Churn and Segment Economics
| Mobility — Subscribers, Churn and Segment Economics | FY2021 | FY2022 | FY2023 | FY2024 | FY2025 |
|---|---|---|---|---|---|
| Postpaid phone subscribers (000s) | 67,260 | 69,596 | 71,255 | 72,749 | 74,214 |
| Prepaid subscribers (000s) | 19,028 | 19,176 | 19,236 | 19,023 | 18,294 |
| Postpaid phone net additions (000s) | 3,196 | 2,868 | 1,744 | 1,653 | 1,551 |
| Postpaid phone churn | 0.8% | 0.8% | 0.8% | 0.8% | 0.9% |
| Postpaid churn (total postpaid) | 0.9% | 1.0% | 1.0% | 0.9% | 1.1% |
| Mobility EBITDA | 30,801 | 32,010 | 34,378 | 36,531 | 37,618 |
| Mobility EBITDA margin | 39.4% | 39.1% | 40.9% | 42.8% | 42.0% |
Source: company filings [11] [12] [13] [14]. Click any linked figure to open the filing page with the row highlighted.
Consumer Wireline — Fiber and Broadband
| Consumer Wireline — Fiber and Broadband | FY2021 | FY2022 | FY2023 | FY2024 | FY2025 |
|---|---|---|---|---|---|
| Broadband connections (000s) | 13,845 | 13,753 | 13,729 | 13,987 | 14,704 |
| Fiber broadband connections (000s) | 5,992 | 7,215 | 8,307 | 9,331 | 10,406 |
| Broadband net additions (000s) | 152 | (92) | (24) | 258 | 729 |
| Fiber broadband net additions (000s) | 1,041 | 1,223 | 1,092 | 1,024 | 1,075 |
| Broadband revenues | 9,085 | 9,669 | 10,455 | 11,212 | 12,187 |
| Consumer Wireline EBITDA | 3,617 | 3,803 | 4,120 | 4,530 | 5,250 |
| Consumer Wireline EBITDA margin | 28.8% | 29.8% | 31.3% | 33.4% | 37.0% |
Source: company filings [11] [15] [16] [17]. Click any linked figure to open the filing page with the row highlighted.
Business Wireline — Legacy Runoff vs. Connectivity
| Business Wireline — Legacy Runoff vs. Connectivity | FY2021 | FY2022 | FY2023 | FY2024 | FY2025 |
|---|---|---|---|---|---|
| Legacy and other transitional services revenues | — | — | 13,680 | 11,095 | 9,170 |
| Fiber and advanced connectivity services revenues | — | — | 6,594 | 6,969 | 7,333 |
| Business Wireline EBITDA | 8,284 | 7,604 | 6,666 | 5,467 | 5,018 |
| Business Wireline EBITDA margin | 34.6% | 33.7% | 31.9% | 29.1% | 29.1% |
Source: company filings [11] [16] [12] [17]. Click any linked figure to open the filing page with the row highlighted.
Network Investment and Cash Conversion
| Network Investment and Cash Conversion | FY2021 | FY2022 | FY2023 | FY2024 | FY2025 |
|---|---|---|---|---|---|
| Capital investment (capex plus vendor financing) | — | 24,323 | 23,595 | 22,055 | 22,023 |
| Vendor financing payments | 4,596 | 4,697 | 5,742 | 1,792 | 1,181 |
| Free cash flow (excluding DIRECTV) | — | — | — | 15,300 | 16,600 |
Source: company filings [18] [19] [20] [21]. Click any linked figure to open the filing page with the row highlighted.
Latin America — Mexico Wireless
| Latin America — Mexico Wireless | FY2021 | FY2022 | FY2023 | FY2024 | FY2025 |
|---|---|---|---|---|---|
| Mexico wireless subscribers (000s) | 20,362 | 21,603 | 22,316 | 23,576 | 24,680 |
| Mexico postpaid subscribers (000s) | 4,807 | 4,925 | 5,236 | 5,837 | 6,751 |
| Mexico wireless net additions (000s) | 1,419 | 1,241 | 713 | 1,260 | 1,104 |
| Mexico EBITDA margin | 3.5% | 10.6% | 14.8% | 16.5% | 18.6% |
Source: company filings [22] [23] [24]. Click any linked figure to open the filing page with the row highlighted.
Long-Term Record
| Fiscal year | Total revenue | Operating income | Net income attributable to AT T | Diluted EPS | Operating cash flow |
|---|---|---|---|---|---|
| FY2016 | — | 23,543 | 12,976 | 2.10 | 38,442 |
| FY2017 | — | 19,970 | 29,450 | 4.76 | 38,010 |
| FY2018 | — | 26,096 | 19,370 | 2.85 | 43,602 |
| FY2019 | — | 27,955 | 13,903 | 1.89 | 48,668 |
| FY2020 | — | 8,372 | (5,176) | (0.75) | 43,130 |
| FY2021 | 134,038 | 25,897 | 20,081 | 2.73 | 37,170 |
| FY2022 | 120,741 | (4,587) | (8,524) | (1.13) | 35,812 |
| FY2023 | 122,428 | 23,461 | 14,400 | 1.97 | 38,314 |
| FY2024 | 122,336 | 19,049 | 10,948 | 1.49 | 38,771 |
| FY2025 | 125,648 | 24,162 | 21,953 | 3.04 | 40,284 |
Source: consolidated statements across filings; older years from the standardized feed [9] [1] [10] [2]. Click any linked figure to open the filing page with the row highlighted.
Analyst Consensus
Mean target
Median target
High target
Low target
Street ratings: 12 strong buy, 4 buy, 9 hold, 1 strong sell. Consensus: Buy.
Estimate source: S&P Capital IQ (CapIQ) consensus, as of 2026-07-24. Estimate figures are S&P Capital IQ consensus (vendor data — no filing page links). EPS and net income use the normalized (adjusted) consensus where the street reports it. Line-item analyst models (segments, drivers, KPIs) are in the Visible Alpha tab.
Traceability
449 of 469 figures on this page (96%) link to the filing page where they are printed — click a linked figure to open the source PDF at that page with the row highlighted. Unlinked figures come from standardized data feeds or pre-filing years.
Continuing-operations basis: AT T spun off WarnerMedia in April 2022 and the FY2022 Form 10-K reclassified it to discontinued operations. FY2021 and FY2022 figures shown here are the restated continuing-operations numbers taken from the FY2022/FY2023 10-Ks — so FY2021 total operating revenues are $134,038M, not the $168,864M originally reported in the FY2021 10-K. This keeps the five-year statements comparable.
The FY2021 balance sheet still carries $119,776M of WarnerMedia 'Assets from discontinued operations' (held for sale at 12/31/2021), which inflates FY2021 total current assets ($170,768M) and total assets ($551,622M) relative to later years.
FY2021 'Corporate and Other' segment revenue ($16,561M) includes legacy Video/DIRECTV and held-for-sale reclassifications and is therefore not comparable to the ~$0.4–0.5B reported in FY2022–FY2025.
Cash-flow FY2021 and FY2022 are the 'from Continuing Operations' subtotals (they exclude discontinued WarnerMedia cash flows); FY2023–FY2025 are total company (no discontinued operations remaining).
The income.json data feed contains no revenue line; all revenue and detailed income-statement rows were read directly from the filings.
Long-Term Record: FY2016–FY2020 figures come from the standardized SEC XBRL data feed (as originally reported, including WarnerMedia and DIRECTV) and are shown without page links; FY2021–FY2025 are from the 10-Ks on the current continuing-operations basis. A structural break occurs at the 2022 WarnerMedia spin-off, so pre-2021 revenue is omitted from the long-term table for comparability.
Segment note: AT T reports a Communications segment (business units Mobility, Business Wireline, Consumer Wireline) plus a Latin America segment and Corporate and Other. The FY2021/FY2022/FY2023 segment notes include an EBITDA column while the FY2024/FY2025 notes do not; revenue and operating income reconcile across both layouts.
Quarterly Q4 FY2025 has no Form 10-Q. Its income and cash-flow cells are derived as full-year FY2025 (Form 10-K) minus the nine-month year-to-date figures; the balance sheet uses the 10-K year-end. Single-quarter cash flows for Q2/Q3 FY2025 and Q2 FY2026 are derived from the printed year-to-date statements (each quarter's YTD minus the prior quarter's YTD).
1 figure(s) differed between the data feed and the filing; the filing value is shown (see the run's metrics/metrics_tab.json for the audit trail).
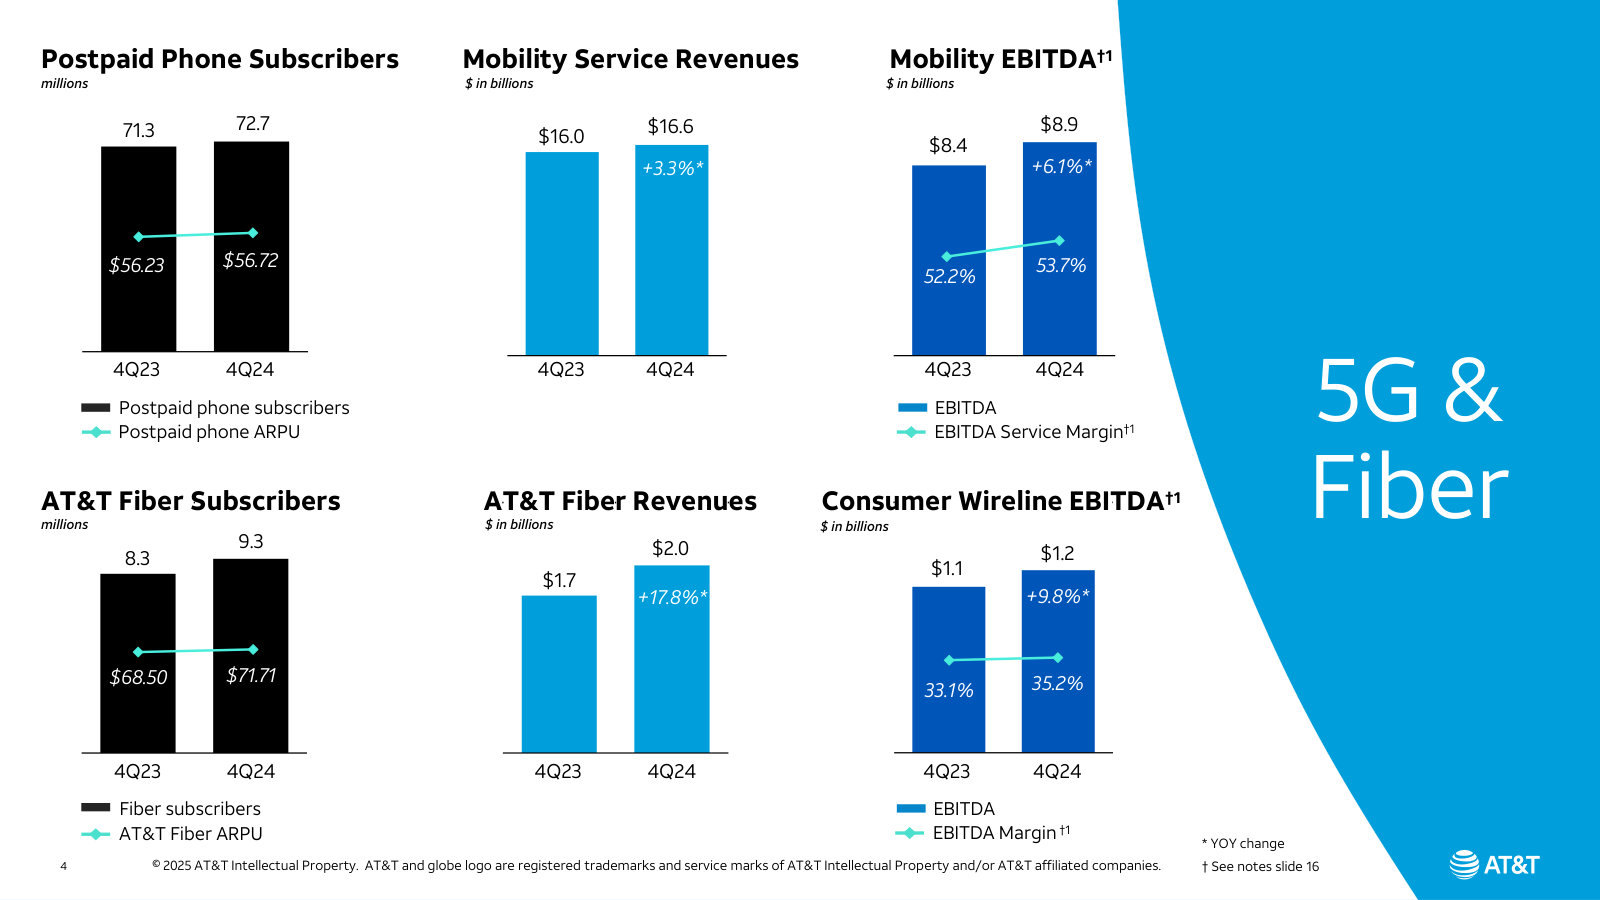
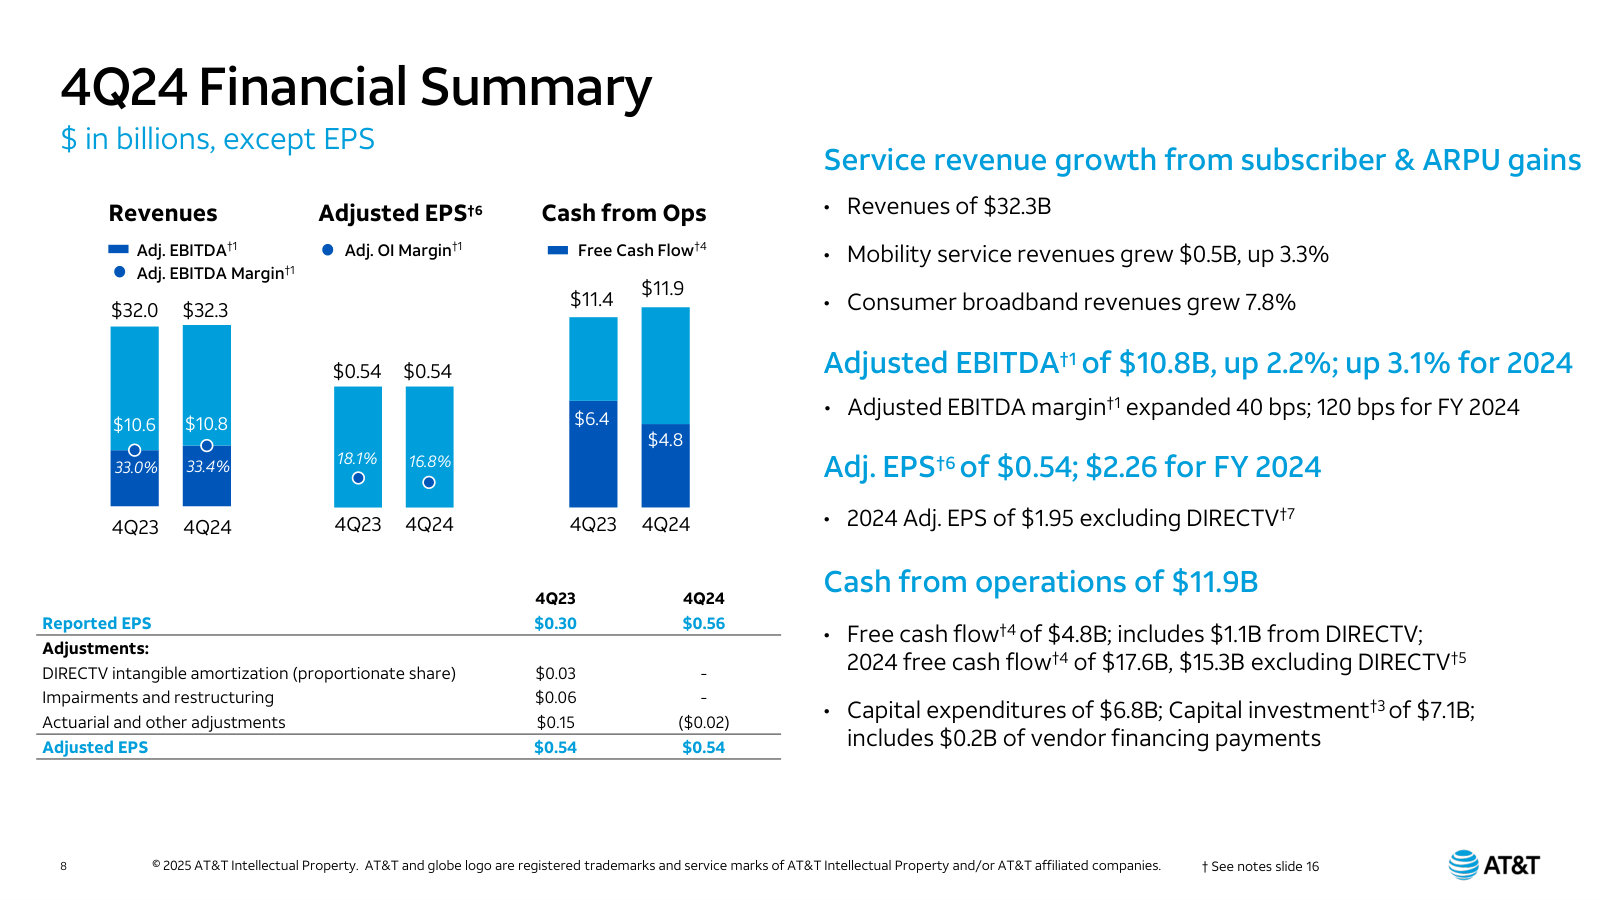
AT&T Inc.'s management explains the business in its own materials. The slides below do the most of that work, pulled from the documents preserved in Sources. Each source link opens the complete presentation at that slide in a new tab.
AT&T 2Q2026 Earnings — Q2 2026
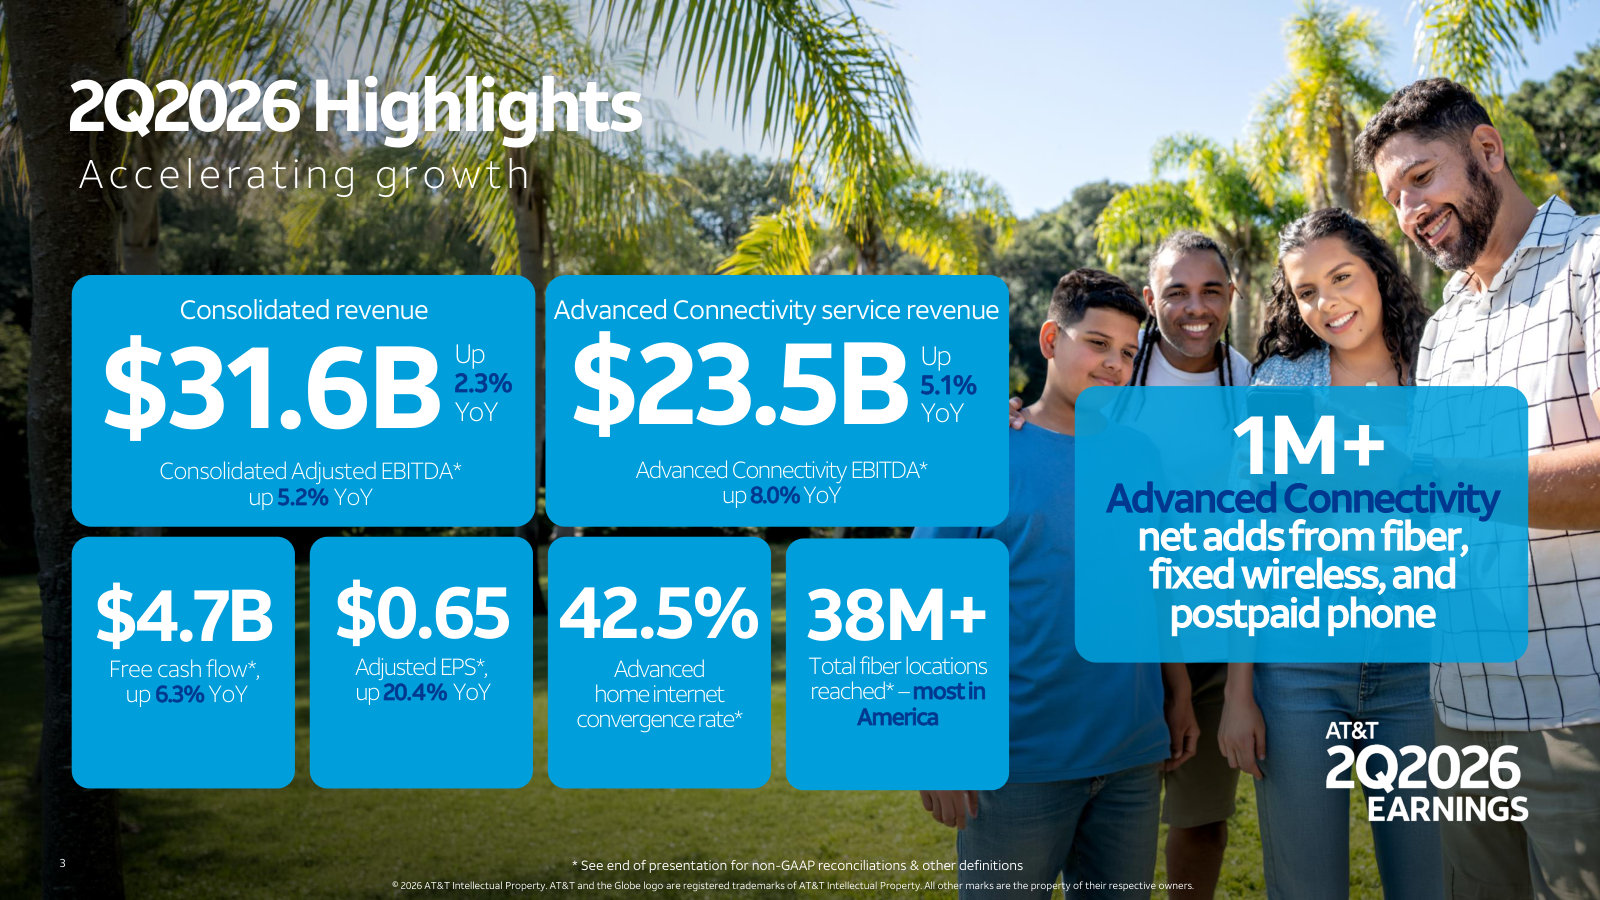
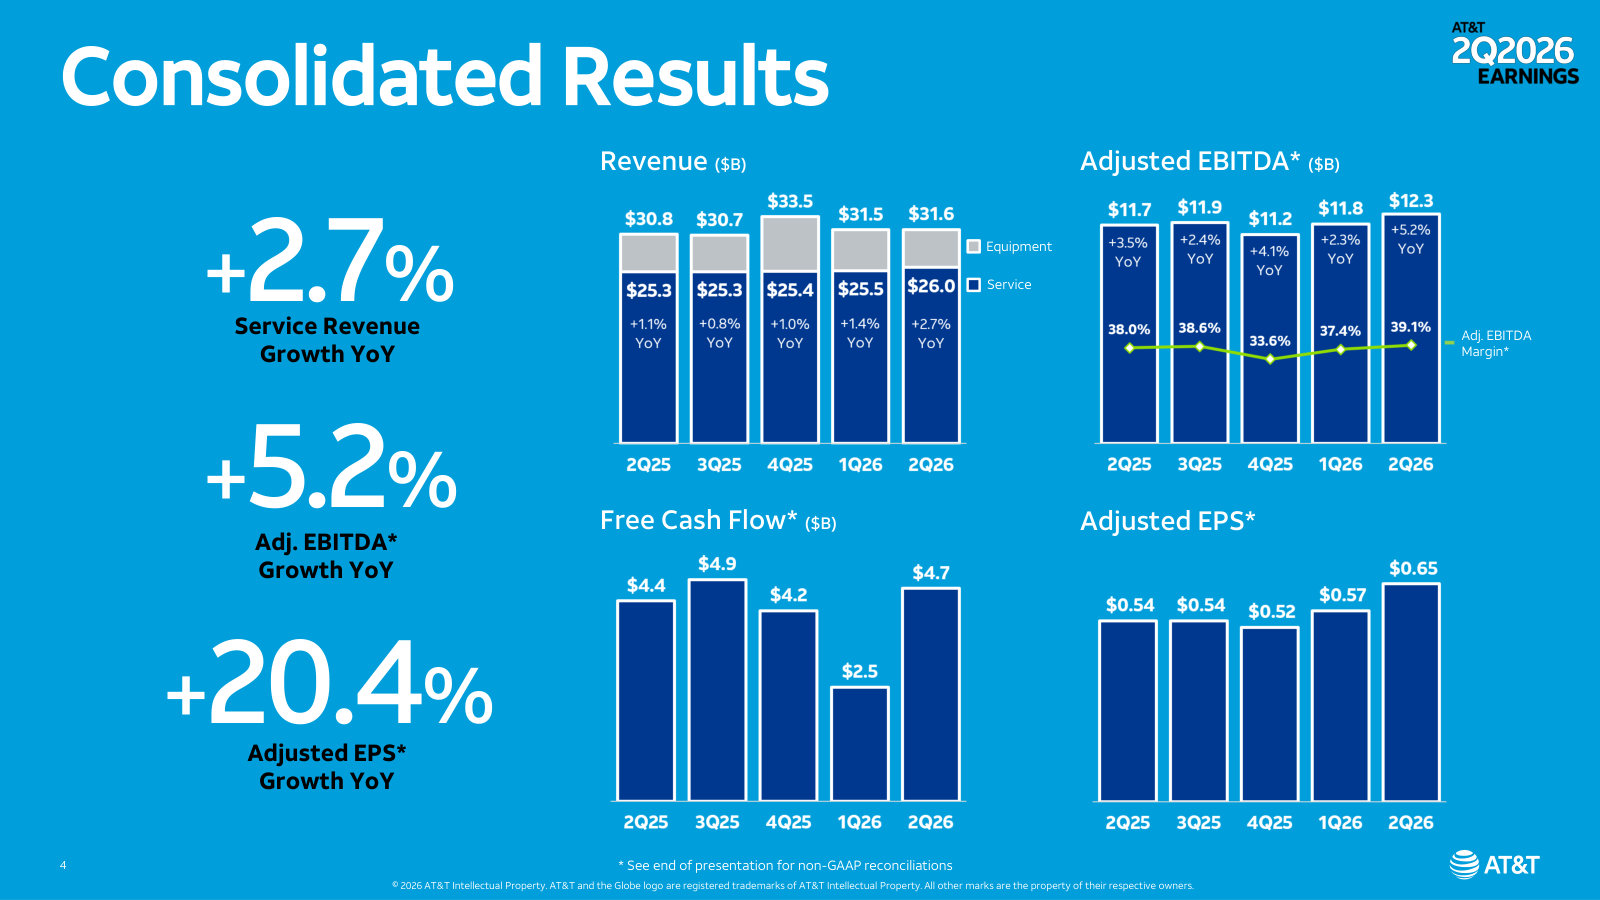
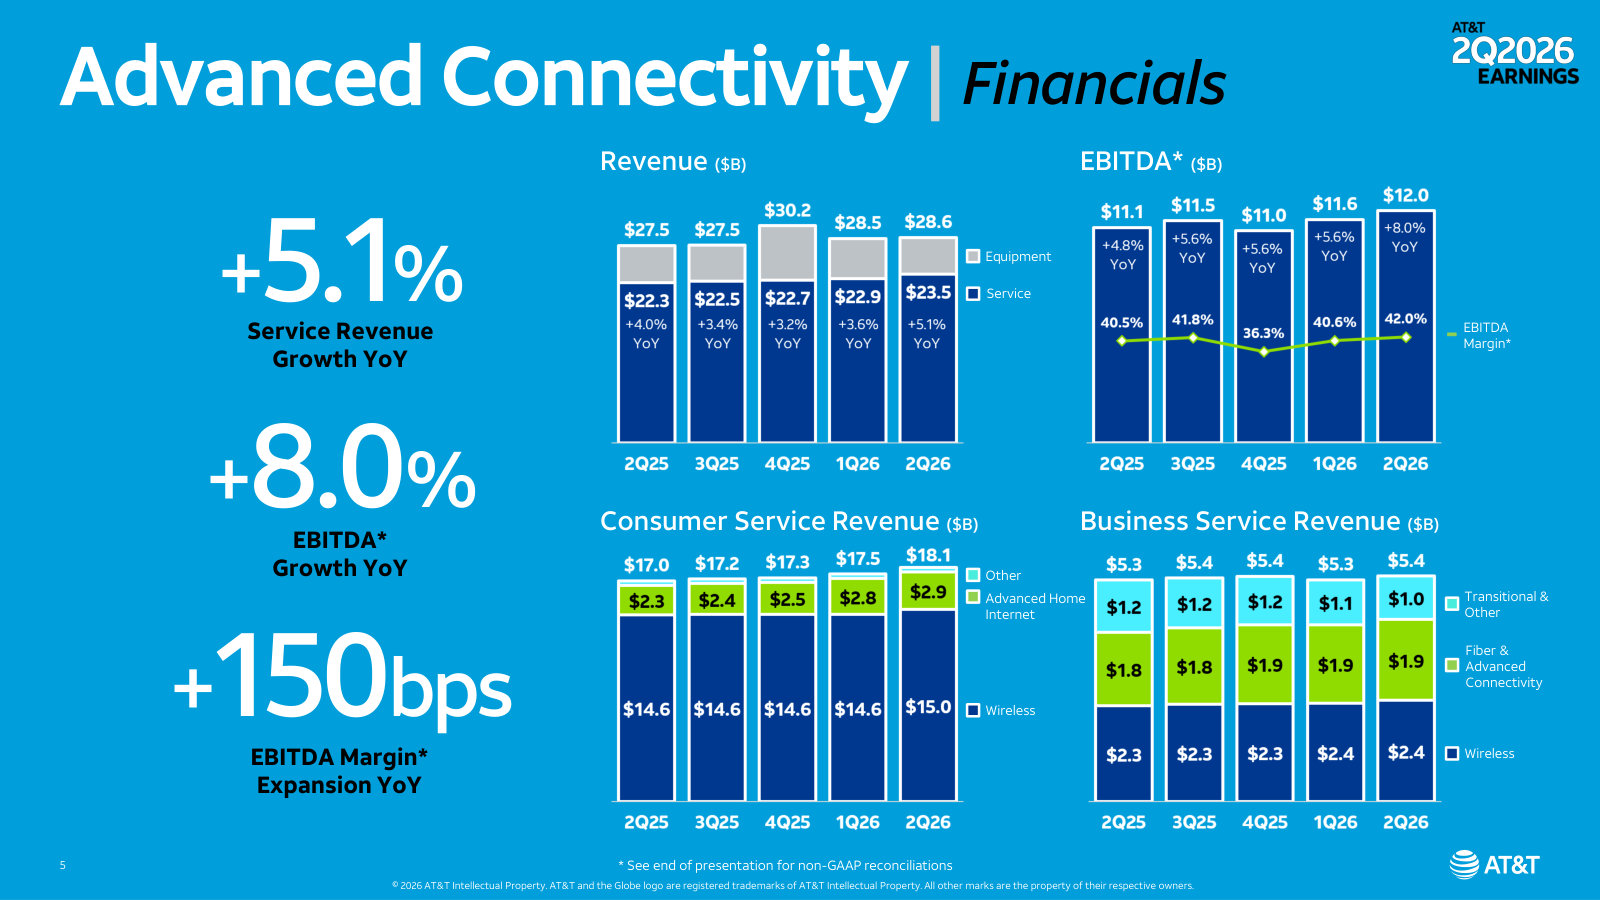
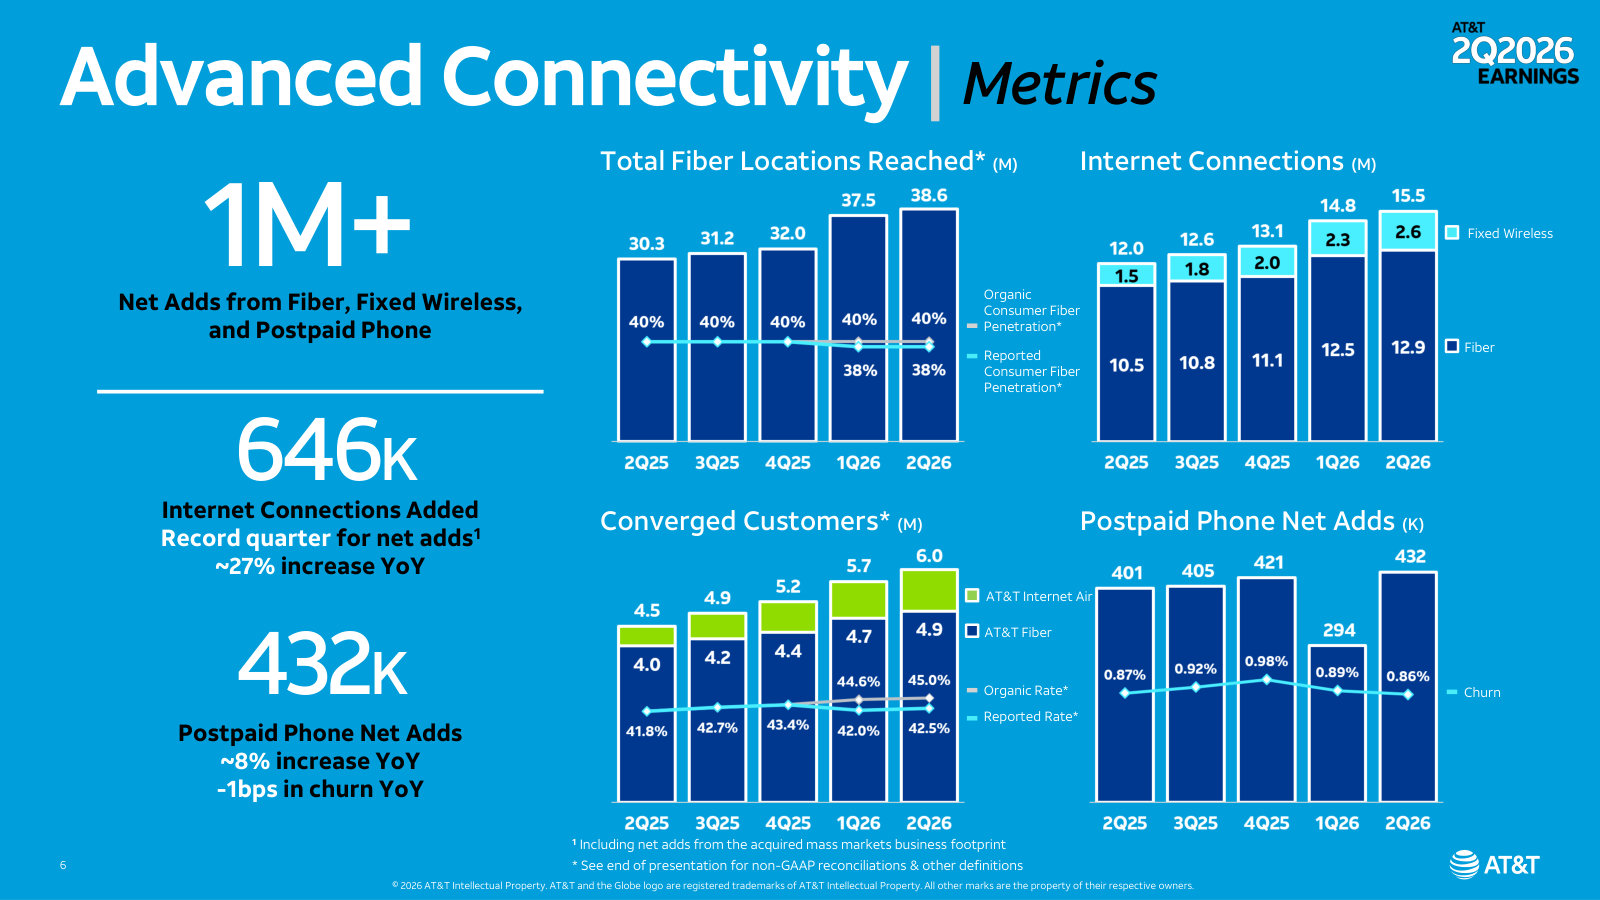
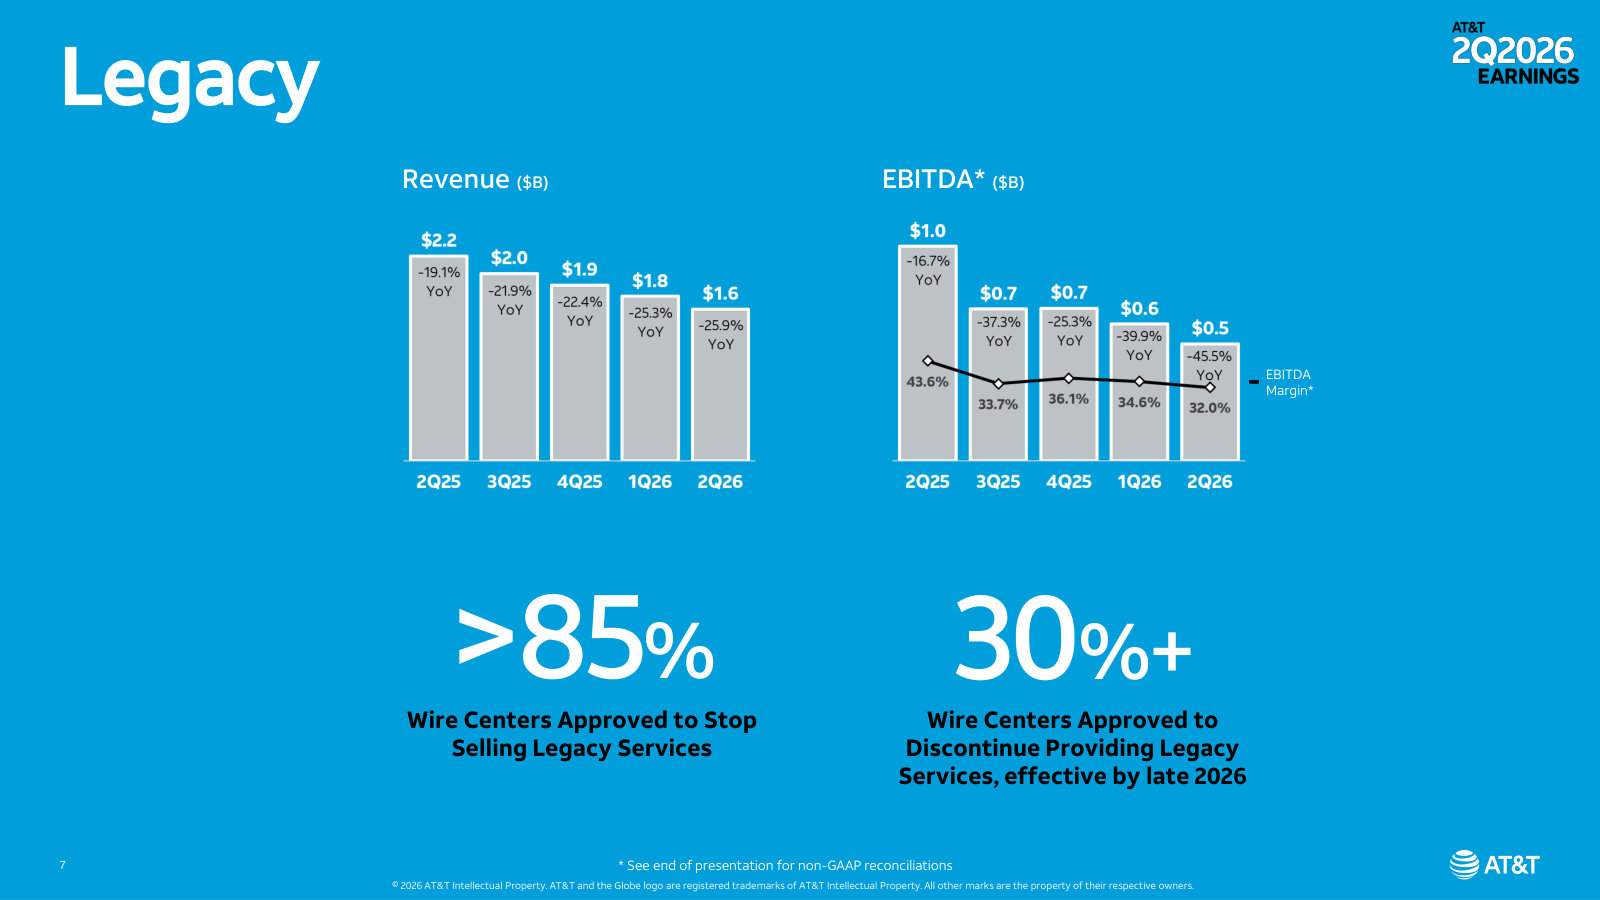
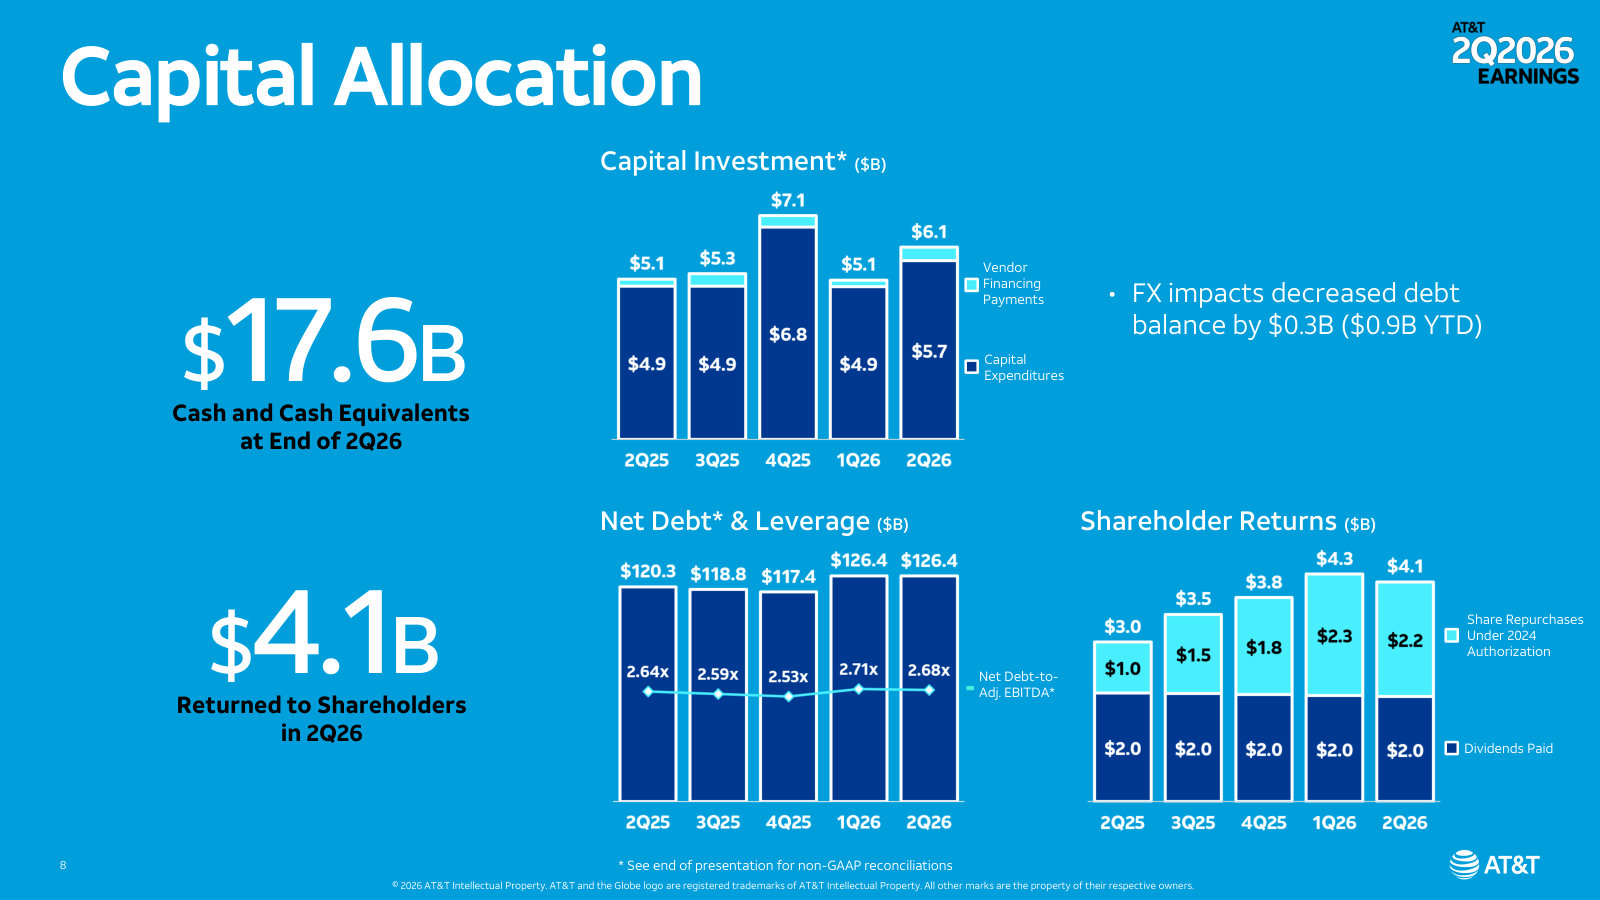
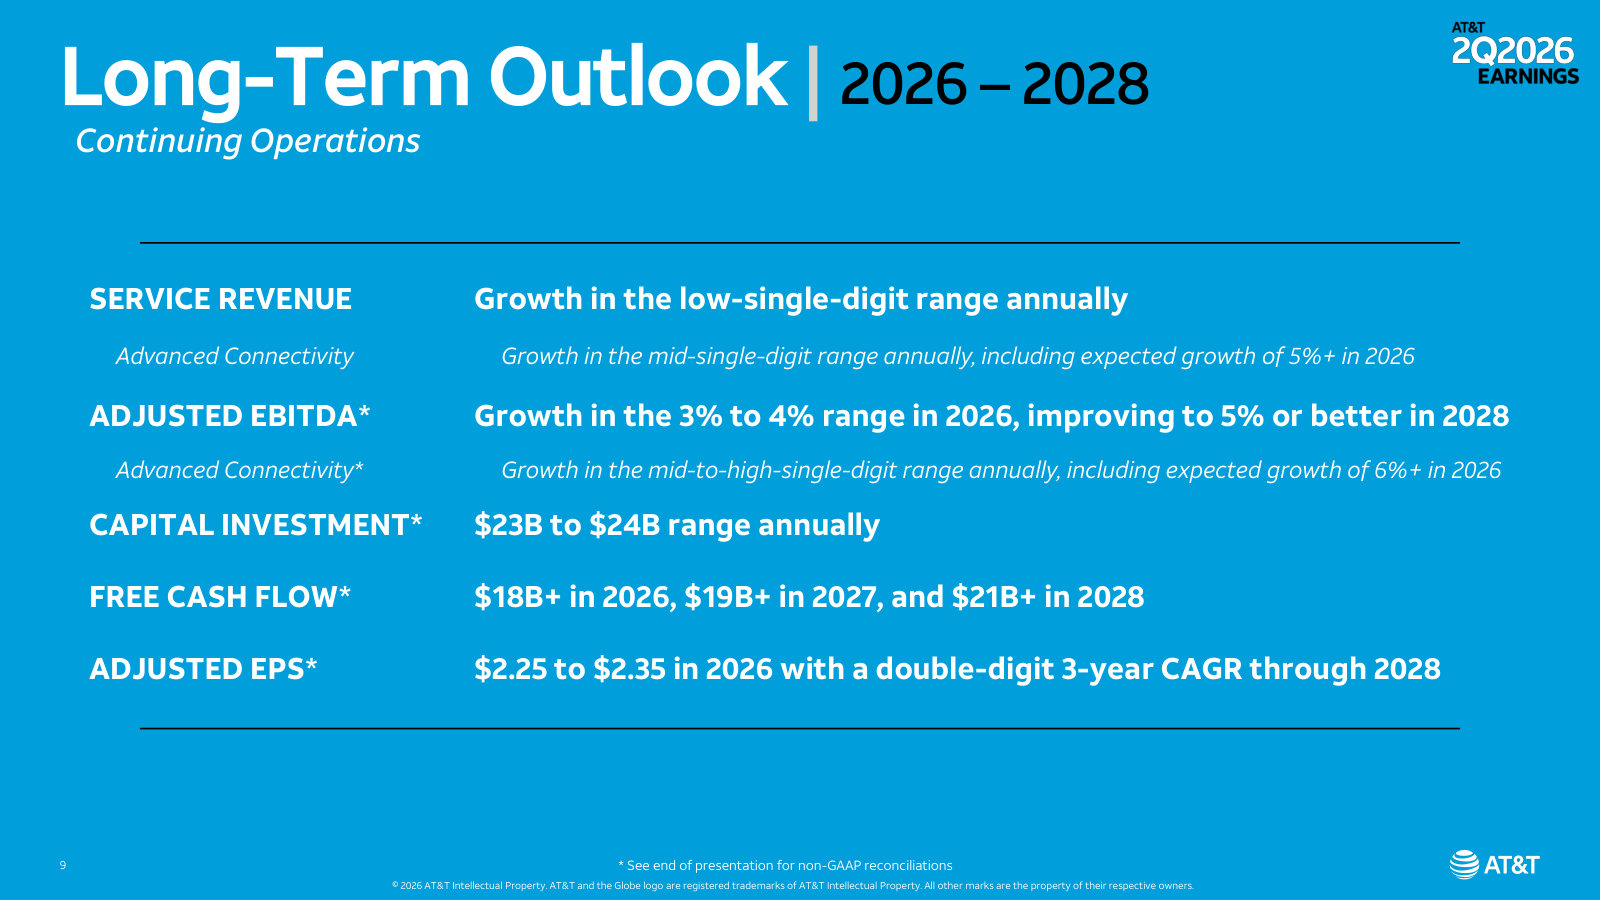
The newest deck, and the clearest picture of AT&T today: it splits the company into the growing 'Advanced Connectivity' business and the shrinking 'Legacy' one, then lays out the 2026-2028 targets. · Open the full document →
AT&T 4Q2025 Earnings — Q4 2025 / FY2025
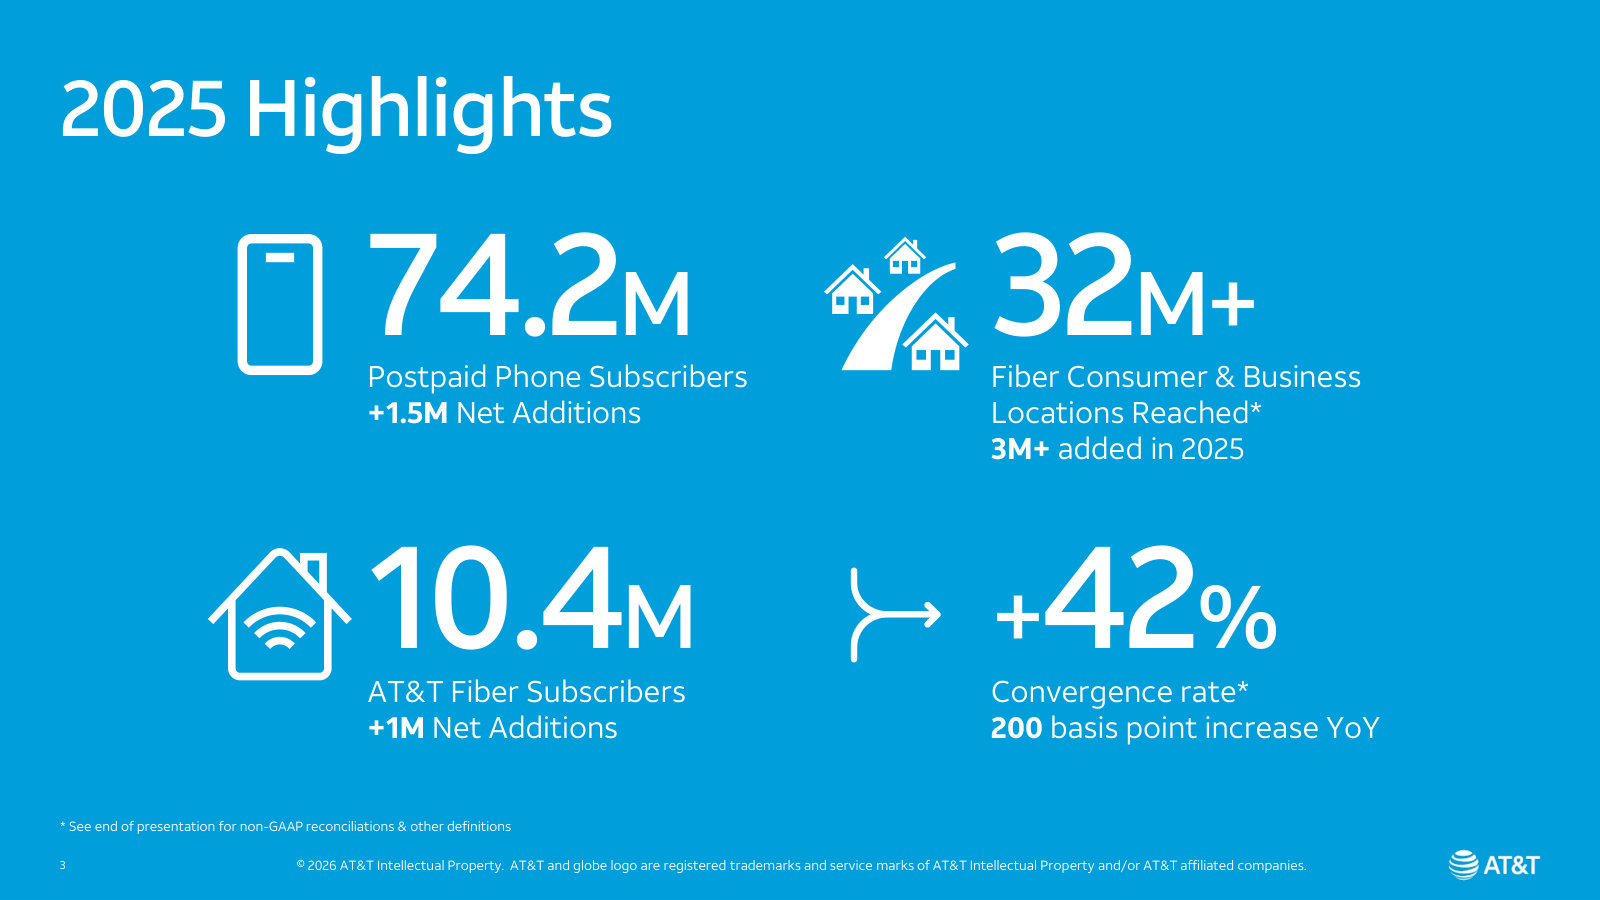
The most recent full-year deck, and the best look at AT&T's economics one segment at a time — Mobility, Consumer Wireline, and Business Wireline. · Open the full document →
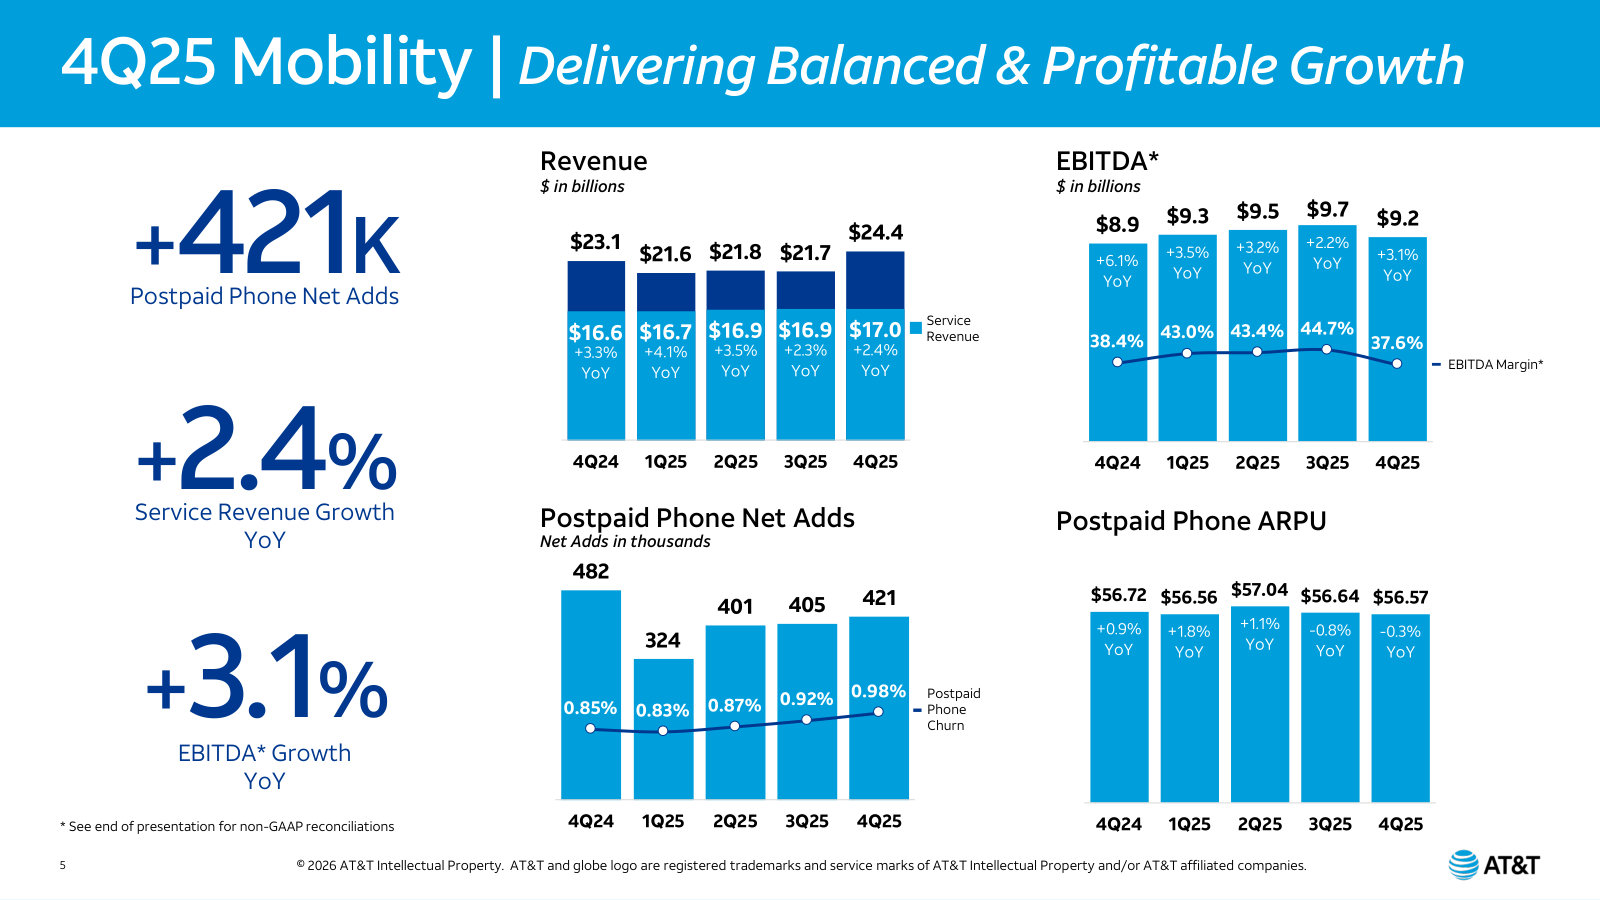
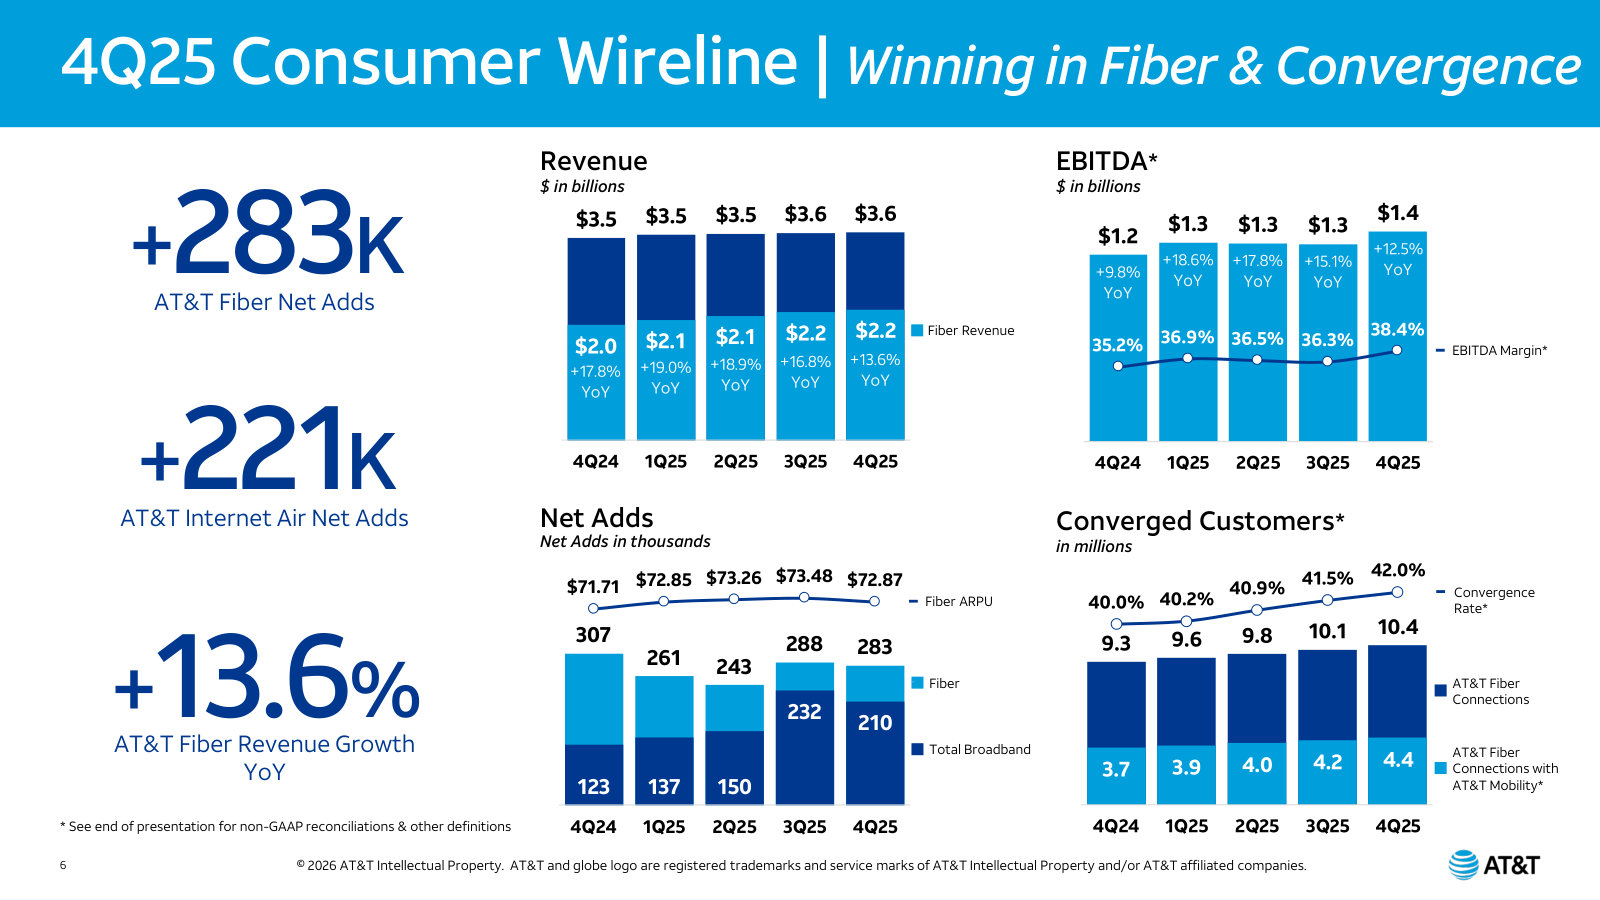
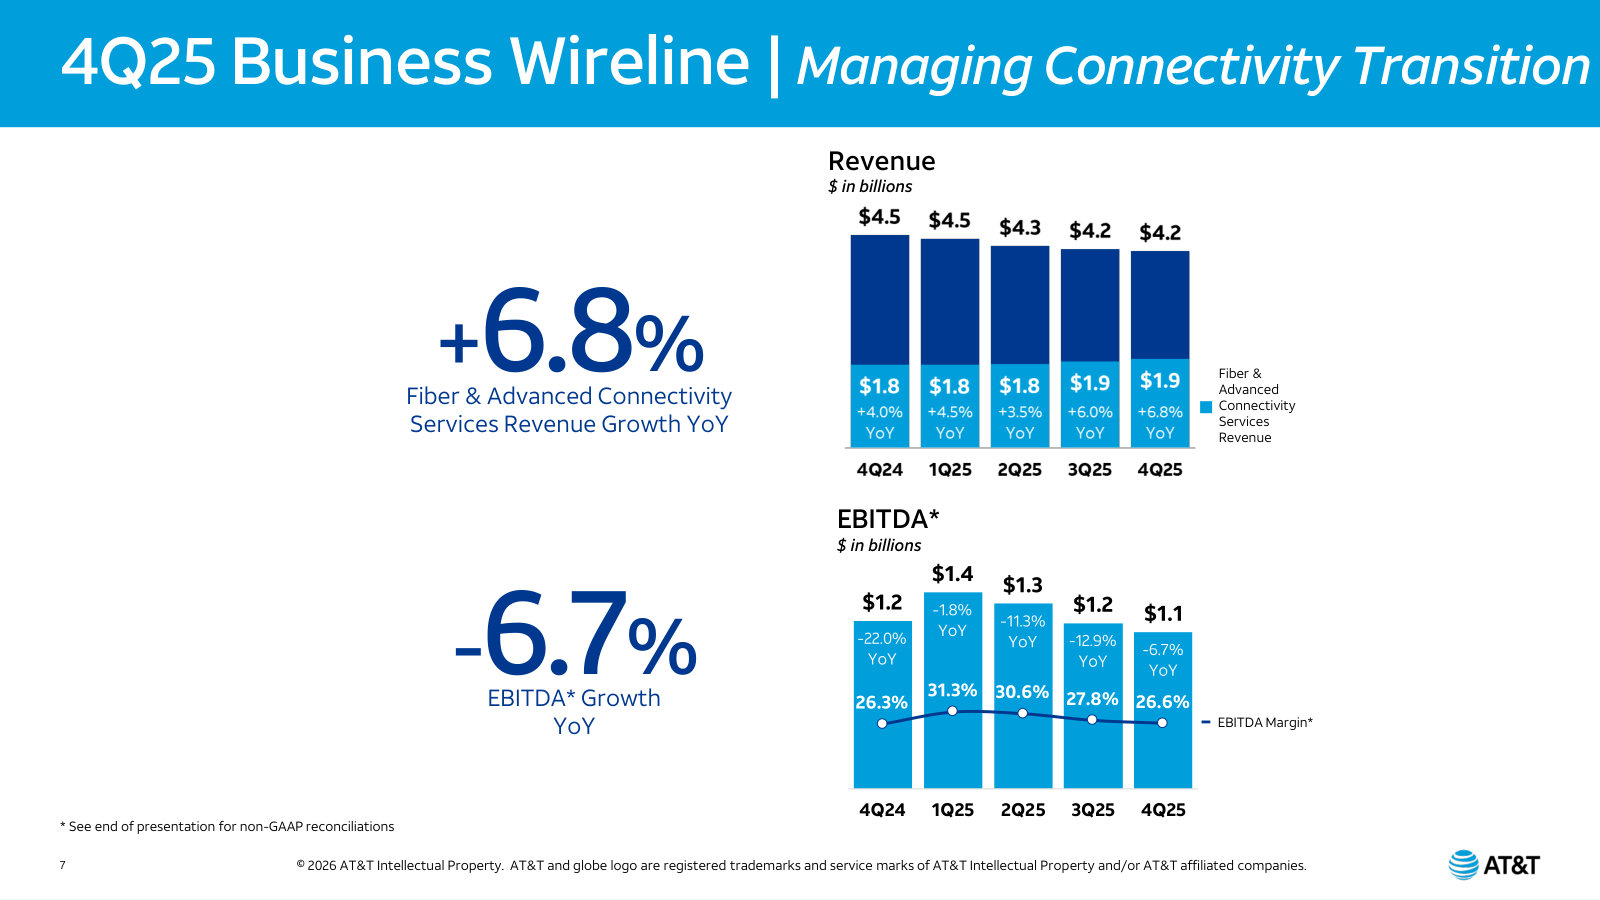
AT&T 4Q2024 Earnings — Q4 2024 / FY2024
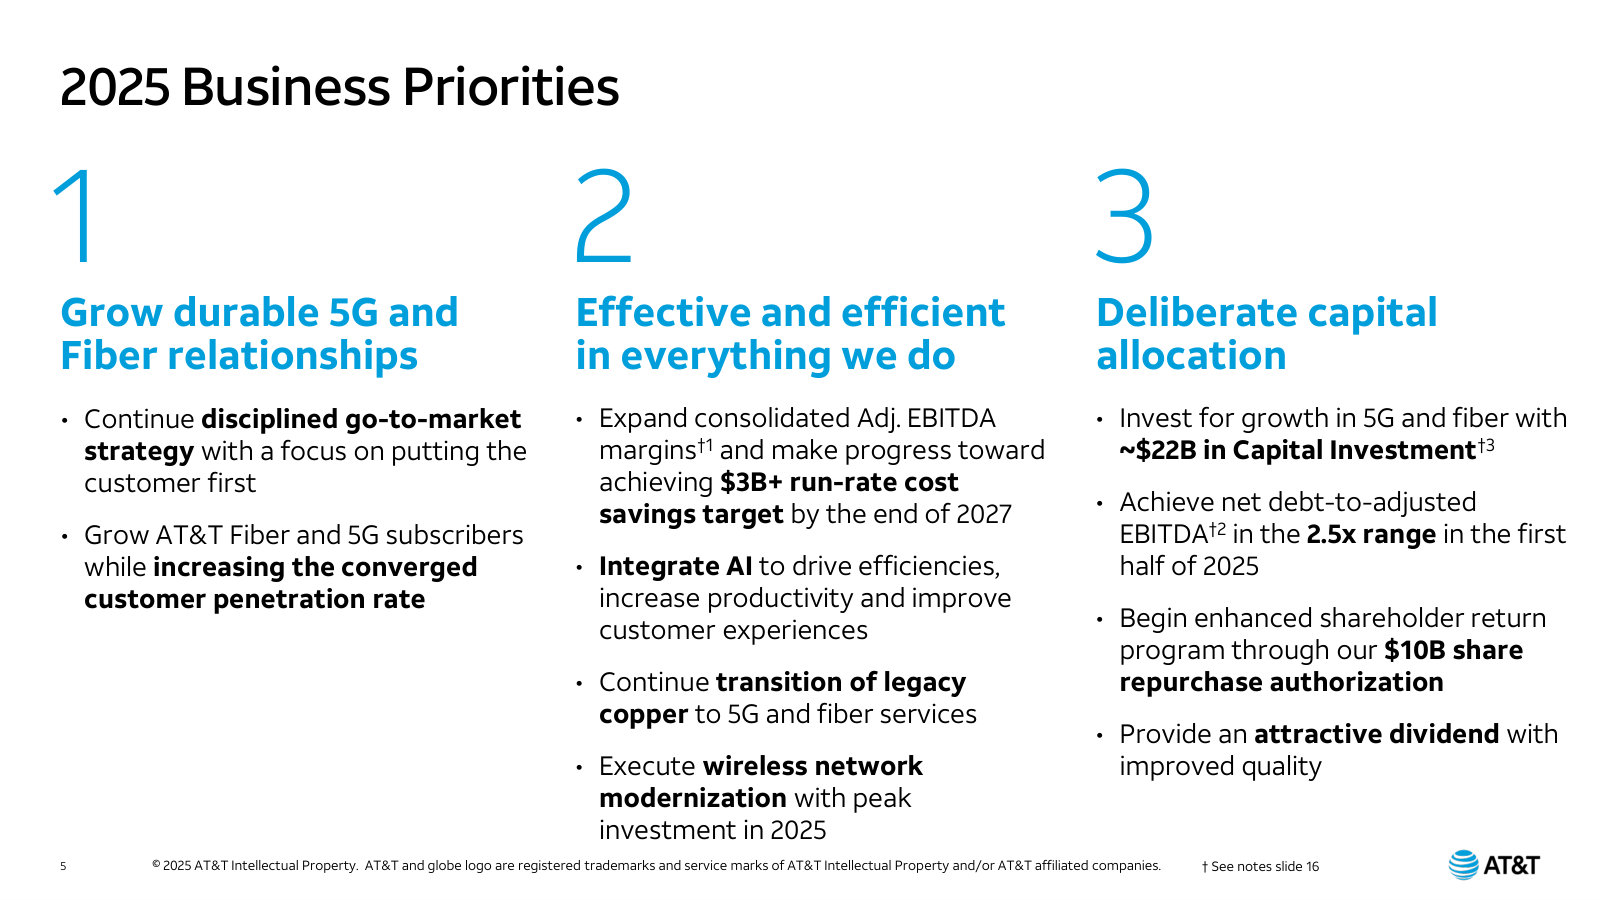
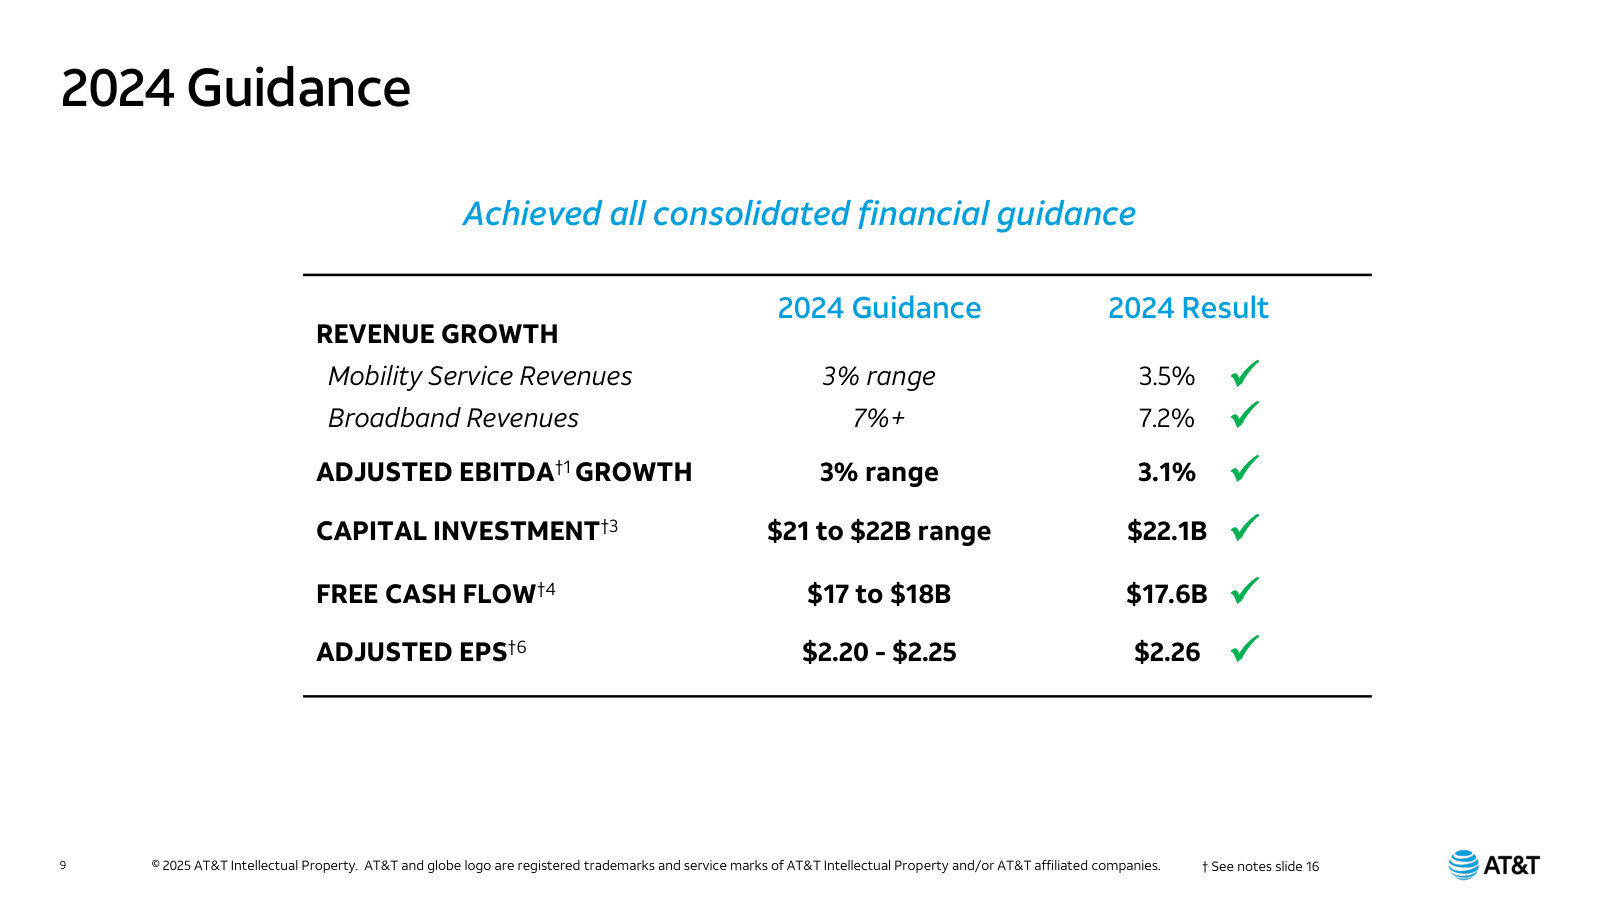
The strategy deck of the set: the three-pillar 'business priorities' framework, the AT&T Guarantee, and a scorecard showing management hit every 2024 target. · Open the full document →
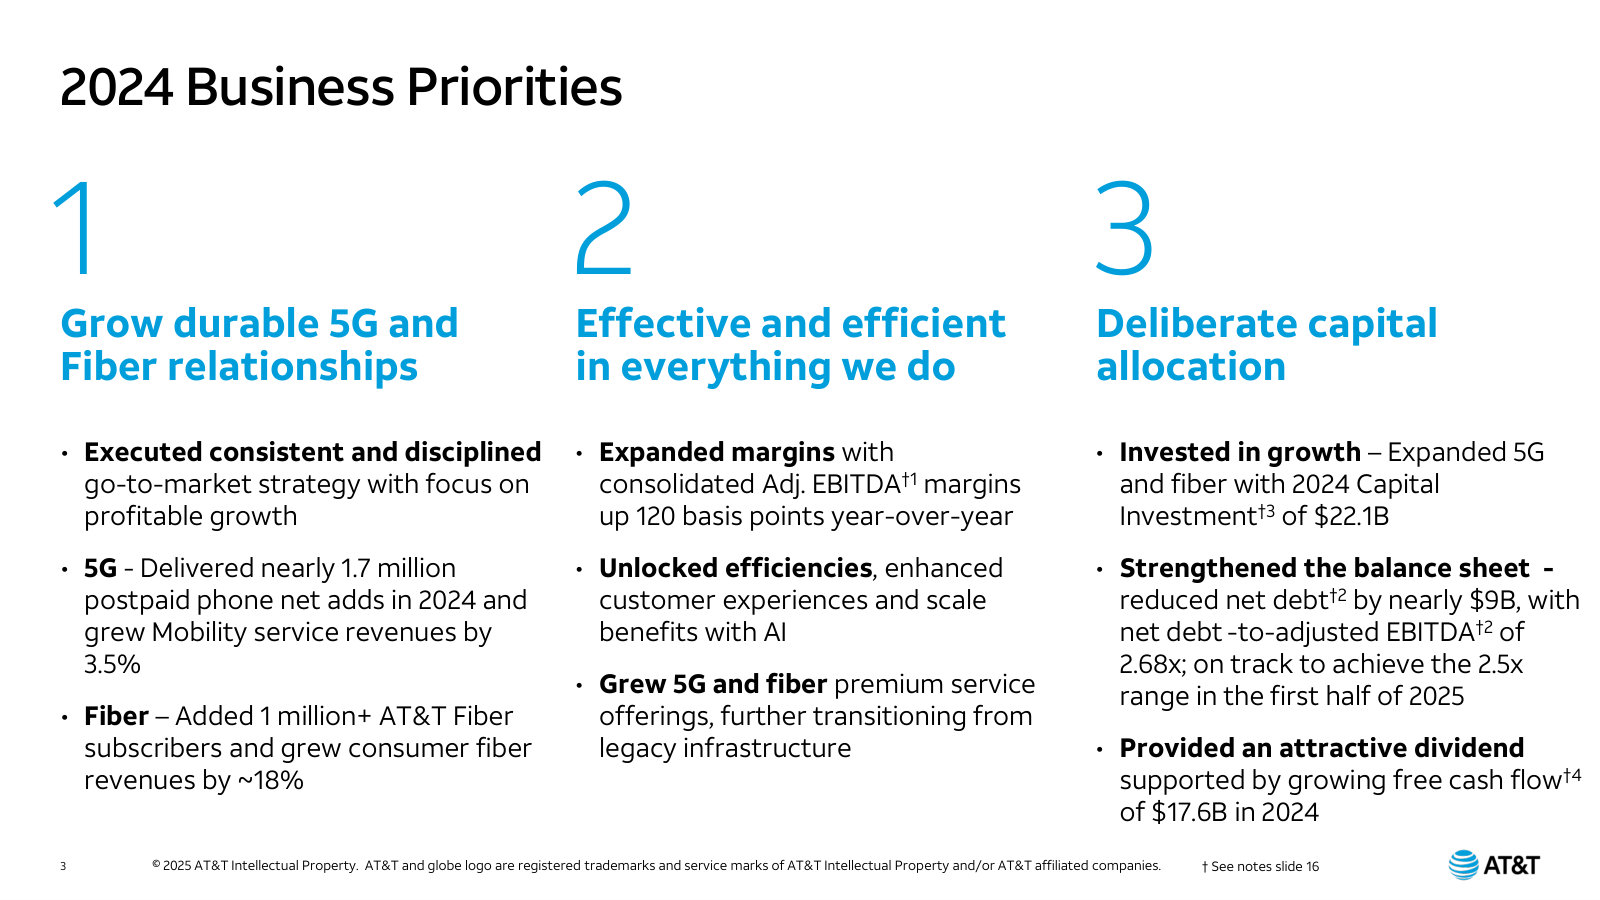
More from management
AT&T 1Q2026 Earnings — Q1 2026 · 14 pages · The first deck to report under the new Advanced Connectivity vs Legacy structure — the transition quarter for how AT&T presents itself. · Open →
AT&T 4Q2023 Investor Update — Q4 2023 / FY2023 · 13 pages · The FY2023 baseline: the same three-pillar priorities framework and segment results one year earlier, before the current growth phase. · Open →
AT&T Inc.'s management answers for the business every quarter. These are the exchanges that explain it best — verbatim, from the call transcripts preserved in Sources. Each link opens the full transcript at that page in a new tab.
Q2 FY2026 Earnings Call — Q2 FY2026
The current operating model in management's own words — the convergence flywheel, fiber pricing, the capital-return math, and the satellite-competitor question answered head-on. · Open the full transcript →
Why falling fiber ARPU is by design — the metric that matters is total Advanced Connectivity revenue, not per-product ARPU.
Pascal Desroches (CFO): This reflects our focus on growing converged customer accounts, which enjoy discounted pricing, but typically stay with us longer and increase their spending over time. […] As we said before, our goal is not to maximize ARPU of individual products, but instead to maximize total Advanced Connectivity service revenues in order to drive attractive returns on our investments in 5G and fiber, and we are expecting continued strong growth in service revenue.
p. 6 · Read in context →
The capital-return math: ~$18B to holders (≈100% of FCF), buybacks pulled forward to $10B, and the post-EchoStar deleveraging path.
Pascal Desroches (CFO): We returned $4.1 billion to shareholders during the second quarter, including approximately $2.2 billion of share repurchases. We are on pace to repurchase nearly $1 billion ofstock in July. And as John previously shared, we now expect to buy back approximately $10 billion of our shares in 2026. This compares to our prior target of $8 billion of share repurchases this year and represents a pul forward of our planned buybacks through 2028. Together, our planned share repurchases and expected dividend payments wil total approximately $18 billion this year, which is essentially 100% of our outlook for free cash flow. […] We ended the second quarter with net debt to adjusted EBITDA of 2.68 times, which was essentially flat with the first quarter. We continue to expect that our net leverage ratio will increase following the close of our transaction with EchoStar to the 3.2 times range and then return to a level consistent with our target in the 2.5 times range within approximately three years following the close of the EchoStar transaction.
p. 6 · Read in context →
Fiber pricing philosophy: serve the whole value-to-performance continuum on the lowest-cost network, optimizing the household.
John Stankey (Chairman & CEO): Once we put the fiber infrastructure in place, my point of view is there isn't a customer out there that shouldn't be ours. We have the best technology. It can be operated at the lowest marginal cost. […] But the silly thing would be to serve those value-oriented customers on a higher cost infrastructure. And so we want to make sure that our fiber product offerings match to the continuum, both the value-oriented and the performance-oriented shopper. And we can do that really well, especially when the customers converge, because we're not just optimizing for one product, but we're optimizing for the suite of products that the customer has in home. And as we shared with you, we get lower churn on those customers, a higher lifetime value and higher brand affinity.
p. 8 · Read in context →
The hardest question — Starlink as an MVNO competitor. Stankey: a wholesale deal solves a problem he doesn't have at 98% coverage.
John Stankey (Chairman & CEO), answering Craig Moffett (MoffettNathanson): when we think about a wholesale arrangement, as I said before, the motivation for a wholesale arrangement is always to get on a part of the market that you can't get at yourself. […] And I don't necessarily need a wholesale arrangement to go and address that 2% of the traffic that I can't get at today, because I can get at 98% of the traffic. I'm solving for a much smaller equation. […] So I'm not prone to look for a wholesale agreement to go solve the problem I don't have. I am from to look for a partnership to solve the 2%.
p. 13 · Read in context →
Q4 FY2025 Earnings Call — Q4 FY2025
The annual call that lays out the whole framework: long-term guidance through 2028, the $45B capital-return plan, and the convergence economics driving it. · Open the full transcript →
The three-year frame: capital intensity falling to mid-teens, $45B+ of returns equal to ~30% of market cap and >75% of free cash flow.
John Stankey (Chairman & CEO): As we complete these investments, we expect our capital intensity to decline from a high-teens percent of revenue to the mid teens, driving higher durable long-term cash flow. […] Over the next three years, we expect to drive accelerated growth in adjusted EBITDA, double-digit adjusted EPS growth, and strong free cash flow. We also expect to return over $45 billion to our shareholders over the next three years through our attractive dividend and consistent pace of share repurchases. This represents nearly 30% of our market cap and over 75% of our expected free cash flow.
p. 3 · Read in context →
The hard guidance numbers behind the story: EBITDA 3–4% to 5%+, EPS $2.25–$2.35 with a double-digit CAGR, FCF over $18B in 2026.
Pascal Desroches (CFO): Putting this all together, we expect to achieve growth in consolidated adjusted EBITDA in the 3% to 4% range in 2026, improving to 5% or better in 2028. We expect adjusted EPS to be in the $2.25 to $2.35 range in 2026, with a double-digit three-year CAGR through 2028. […] For 2026, we expect free cash flows of over $18 billion, reflecting primarily growth in adjusted EBITDA, lower pension contributions, and lower legal settlements, partially offset by higher capital investments and cash interest. We expect free cash flows to grow by over $1 billion in 2027 and approximately $2 billion in 2028, driven primarily by growth in adjusted EBITDA.
p. 5 · Read in context →
The capital-return mechanics: dividend maintained, ~$8B of 2026 buybacks, and a fresh $10B authorization underpinning the $45B plan.
Pascal Desroches (CFO): In 2025, we returned over $12 billion to shareholders, including over $8 billion in dividends and over $4 billion in share repurchases. As we outlined in our earnings release, we expect to return over $45 billion to shareholders during 2026 to 2028. Under this capital return plan, we expect to maintain our current common stock dividend with a consistent pace of share repurchases through 2028, including approximately $8 billion of buybacks in 2026. Our board has authorized an additional $10 billion of share repurchases after we complete buybacks under the current authorization.
p. 6 · Read in context →
Q2 FY2023 Earnings Call — Q2 FY2023
The call after the lead-clad cable shock — how management defended the balance sheet and dividend against a new environmental/legal risk, alongside the fiber build economics. · Open the full transcript →
Fiber unit economics laid bare: 3.4M net adds (+80%), ~38% penetration, doubled fiber revenue to >$1.5B, and +$10 (20%) broadband ARPU.
John Stankey (CEO): Over the past three years, we've had more than 3.4 million AT&T fiber net adds, boosting our subscriber base by roughly 80%. Everywhere we put fiber in the ground, we feel good about our ability to win with consumers. In fact, our average penetration rate is about 38%. […] Since the second quarter of 2020, we've doubled our quarterly fiber broadband revenues, reaching more than $1.5 billion this quarter. And over the past three years, the accretive mix shift to fiber has driven our broadband ARPU up more than $10, an increase of 20%.
p. 5 · Read in context →
The lead-clad cable defense, prepared: independent science shows no public-health risk; cooperating with the EPA and testing selected sites.
John Stankey (CEO): Independent experts and long-standing science have given us no reason to believe these cables pose a public health risk. And our own prior testing, which we shared publicly, confirms the established science. Still, to be responsive to any concerns raised by recent reporting, we're doing additional testing at selected sites. […] We're working cooperatively with the Environmental Protection Agency to provide them the information needed to conduct a thorough assessment of the issue using the most up-to-date reliable science.
p. 12 · Read in context →
The thesis-testing exchange: with litigation pending Stankey is guarded, but says the lead issue doesn't change his dividend view.
John Stankey (CEO), answering David Barden (Bank of America): So, Dave, thanks for asking the question that I guess needed to be asked. I'm limited in how much I can say. I'll try to be somewhat responsive to share. But if you are unsatisfied with a little bit of the background I give here, I apologize. […] But you also have to understand we're in a unique position that we do have actual litigation pending right now on some of this out in Lake Tahoe, and that maybe puts us in a little bit different place. So, I need to be somewhat sensitive around that. So, let me start at the back end, and then I'll try to tick through. I don't think it changes my point of view of how I think about the dividend.
p. 27 · Read in context →
The substantive rebuttal: no regulator flagged lead-cable handling and nothing material to disclose — same message to credit agencies.
John Stankey (CEO): has anybody come in and said, "Hey, we've got issues around what you're doing with lead cables, or you're not handling this correctly," the answer is no. […] We haven't disclosed anything out publicly about claims because there hasn't been anything material to disclose is what I would tell you. And I don't know that I would go any further than that. And, you know, the way we're talking to credit agencies around this issue is exactly how we're talking to you about it.
p. 28 · Read in context →
Q1 FY2023 Earnings Call — Q1 FY2023
The free-cash-flow credibility test — a soft Q1 print and analysts demanding proof the $16B full-year target holds, with management walking through the seasonal bridge. · Open the full transcript →
The quarter that spooked the market: $1B of FCF framed as seasonal timing, with the full-year $16B+ target reaffirmed.
Pascal Desroches (Senior EVP & CFO): Cash from operating activities came in at $6.7 billion versus $7.6 billion last year. This was largely due to the timing of working capital, which includes lower securitizations. As a reminder, the first quarter is typically the high watermark for device payments, and we expect payments to progressively get lower as we make our way through the balance of the year. […] Free cash flow for the quarter was $1 billion. This was consistent with our expectations and accounts for several seasonal and anticipated working capital impacts. We remain confident in our full year outlook for free cash flow of $16 billion or better. This expectation is largely due to the timing of capital investments, device payments, incentive compensation, which all peaked in the first quarter.
p. 5 · Read in context →
The credibility test: after last year's 2Q guide-down, Cusick asks why to trust the $16B target. Stankey walks the Q1 'low watermark' logic.
Philip Cusick (JPMorgan); John Stankey (CEO): Let's start with free cash flow. Given the 2Q free cash flow guide down last year, what can you add to your comments already to get investors comfortable that we aren't walking into another one of those? […] Remember, in my commentary on at the year-end when we gave guidance, we said that Q1 was going to be the low watermark for free cash flow for several reasons. One, it's the highest quarter of device payments. Recall, Q4 holiday sales is the heaviest volume for devices we pay for those in Q1. You saw our capital spend is elevated relative to the annual guidance that we gave. And Q1 is the quarter we pay incentive comp. When you factor all those things in, along with our expectations that we will continue to grow EBITDA, we feel really good about delivering $16 billion or better.
p. 7 · Read in context →
Q1 FY2022 Earnings Call — Q1 FY2022
The pivotal reset call — the WarnerMedia spinoff completed, a rebased dividend and simplified capital framework, and management's first defense of the 'new AT&T.' · Open the full transcript →
The strategic reset: post-WarnerMedia, AT&T reframes itself as a pure-play out to become 'America's best broadband provider.'
John Stankey (CEO): We now have the right asset base and financial structure to devote our energy to becoming America's best broadband provider. Over a five-year period, we expect a fivefold data increase on our networks and we plan to capitalize on the growing desire from consumers and businesses for ubiquitous access to best-inclass connectivity solutions. […] We're seeing record levels of net additions in mobility and consistently strong AT&T Fiber growth, thanks to our disciplined and consistent go-to-market strategy.
p. 4 · Read in context →
The balance-sheet reset: >$50B of assets monetized since 2021 and ~$40B of net debt erased in April, funding the deleveraging path.
John Stankey (CEO): With the completion of the WarnerMedia-Discovery transaction, we've monetized more than $50 billion of assets since the beginning of 2021. And with this transaction, we reduced our net debt by approximately $40 billion in April. […] In fact, we've already addressed some of our near-term maturities and paid off over $10 billion in bank loans.
p. 6 · Read in context →
The new capital-allocation framework: invest first in 5G/fiber (~$24B capex), target 2.5x leverage, and a rebased ~$8B / $1.11 dividend.
Pascal Desroches (CFO): We now have a simplified capital allocation framework. First, we plan to invest in our strategic focus areas: 5G and fiber. […] As previously said, we expect stand-alone AT&T capital investments of $24 billion in 2022 and 2023. Starting in 2024, we expect our capital investment to begin tapering to around the $20 billion range as we surpass peak levels of investments in 5G and transformation. The completion of the WarnerMedia transaction also marks a significant step toward achieving our established goal for net debt to adjusted EBITDA in the 2.5 times range by the end of 2023. […] As previously said, we expect to deliver annual total dividends of around $8 billion, which represents $1.11 per common share.
p. 12 · Read in context →
More calls
Q1 FY2026 Earnings Call — Q1 FY2026 · 12 pages · The quarter before the latest — early read on integrating the acquired Lumen fiber assets and deploying EchoStar spectrum, plus the ongoing buyback. · Open →
Q4 FY2024 Earnings Call — Q4 FY2024 · 11 pages · Where the post-Analyst-Day capital plan turns concrete: commencing share repurchases off the initial ~$10B tranche and the DIRECTV distributions winding down. · Open →
Q3 FY2024 Earnings Call — Q3 FY2024 · 11 pages · The DIRECTV exit — management explains the agreement to sell AT&T's remaining 70% stake to TPG and what a fully connectivity-focused company looks like. · Open →
Q2 FY2024 Earnings Call — Q2 FY2024 · 12 pages · The reader gets management fielding questions on the customer-data breach disclosures and the deconsolidation of the cybersecurity unit into a joint venture. · Open →
Q4 FY2023 Earnings Call — Q4 FY2023 · 36 pages · Full-year 2023 results and the initial 2024 guidance frame for free cash flow, EPS and capital investment as the fiber build moved past its peak. · Open →
Q3 FY2022 Earnings Call — Q3 FY2022 · 38 pages · The first full quarter after the mid-2022 free-cash-flow reset — management showing cost actions and cash generation getting back on track. · Open →
Q2 FY2022 Earnings Call — Q2 FY2022 · 41 pages · The free-cash-flow guide-down that hit the stock — the ~$2B cut from the prior $16B range that every later call had to answer for. · Open →
Q4 FY2021 Earnings Call — Q4 FY2021 · 38 pages · The pre-spin setup — the DIRECTV separation and the terms of the coming WarnerMedia transaction and dividend rebase, before the new AT&T existed. · Open →
AT&T Inc.'s annual reports contain management's most considered account of the business. These are the sections, passages and visual pages worth opening in the originals preserved in Sources.
AT&T Inc. — FY2025 Annual Report (Form 10-K) — FY2025
The current AT&T: a pure connectivity company built on 5G and fiber, with the WarnerMedia and DIRECTV chapters closed and pending Lumen fiber and EchoStar spectrum deals ahead. · Open the full document →
Item 1. Business — General and Areas of Focus — p. 6 · Read the full section →
Management's own framing of the post-media strategy: a converged 5G-plus-fiber network, copper decommissioning, and the pending Lumen and EchoStar transactions.
Strategy stated plainly: lead in connectivity through 5G and fiber, and grow fiber organically and via Lumen and EchoStar.
We are a leader in providing connectivity services through our market focus areas of 5G and fiber. Fiber underpins the connectivity we deliver, both wired and wireless. Building on that fiber foundation is our solid spectrum portfolio, strengthened through Federal Communications Commission (FCC) auctions, other spectrum acquisitions and 5G deployment. […] We will also focus on accelerating our fiber expansion, organically and through our pending acquisition of substantially all of Lumen’s Mass Markets fiber business. We will continue to deploy low- and mid-band spectrum to improve speed and capacity, including spectrum to be acquired from our pending transactions with EchoStar Corporation (EchoStar) and other spectrum acquisitions.
p. 8 · Read in context →
Item 1. Business — Operating Segments — p. 10 · Read the full section →
How AT&T actually makes money now: two segments, with Communications (Mobility, Business Wireline, Consumer Wireline) at ~97% of revenue and 120 million Mobility subscribers.
The Communications segment and its three business units; 120 million Mobility subscribers at year-end 2025.
Our Communications segment provides wireless and wireline telecom and broadband services to consumers located in the United States and businesses globally. […] This segment contains the Mobility, Business Wireline and Consumer Wireline business units. […] As of December 31, 2025, we served 120 million Mobility subscribers, including 91 million postpaid (74 million phone), 18 million prepaid and 11 million through resellers.
p. 10 · Read in context →
Item 1A. Risk Factors — Company-Specific Financial Factors — p. 24 · Read the full section →
The two risks most specific to AT&T that could genuinely bite: cyberattacks (the July 2024 customer-data incident) and the debt taken on to fund spectrum and acquisitions.
Debt raised for acquisitions and spectrum has already driven credit-rating downgrades from historical levels.
We intend to and have incurred debt to fund significant acquisitions, as well as spectrum purchases needed to compete in our industry. While we believe such decisions were prudent and necessary to take advantage of both growth opportunities and respond to industry developments, we did experience credit rating downgrades from historical levels.
p. 30 · Read in context →
Item 7. MD&A — Results of Operations — p. 39 · Read the full section →
Management explains what drove 2025: revenue up 2.7% to $125.6B on Mobility and Consumer Wireline, operating income up 26.8% as the prior-year goodwill impairment washed out.
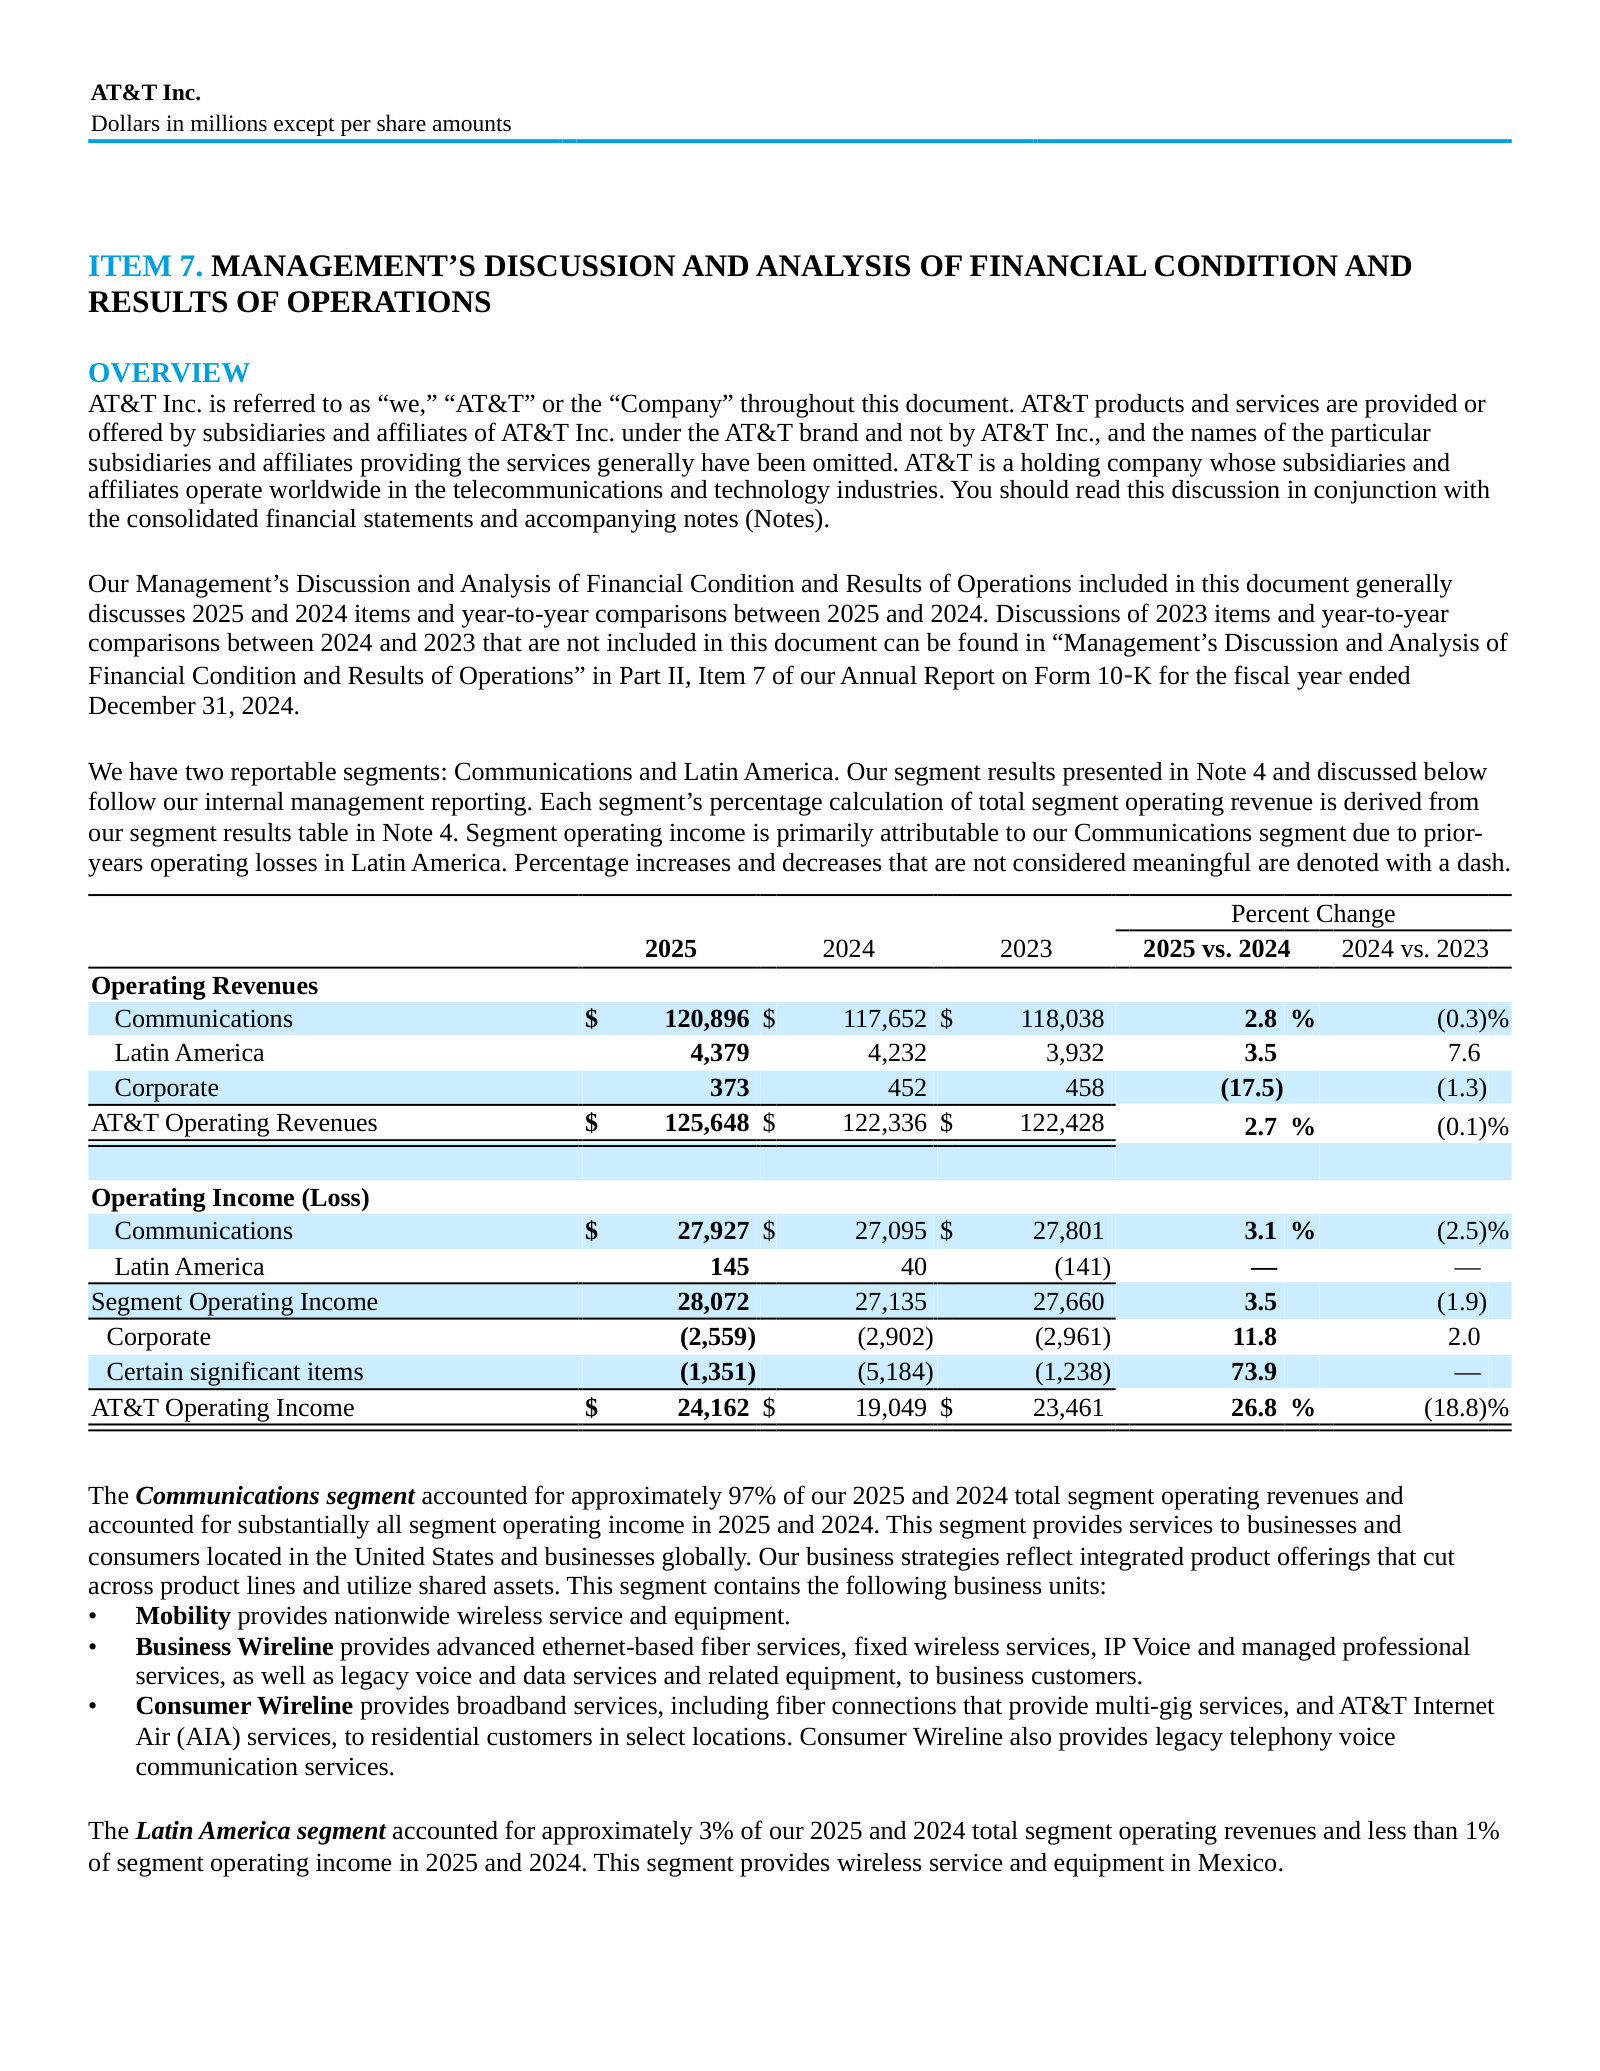
The revenue mix and the margin swing: operating margin 19.2% in 2025 versus 15.6% in 2024.
Operating revenues increased in 2025, reflecting higher Mobility and Consumer Wireline revenues, partially offset by declines in Business Wireline. Operating revenues in Mexico were also higher, overcoming unfavorable foreign exchange impacts during the first half of 2025. […] Our operating margin was 19.2% in 2025, compared to 15.6% in 2024, and 19.2% in 2023.
p. 41 · Read in context →
Item 7. MD&A — Liquidity and Capital Resources — p. 60 · Read the full section →
The cash-and-debt story at the center of the AT&T thesis: $40.3B operating cash flow, $136.1B total debt, and a cash pile built up for pending deals.
Year-end cash swelled to $18.2B ahead of announced transactions; the DIRECTV disposition and receivables sales fed inflows.
We had $18,234 in cash and cash equivalents available at December 31, 2025, increasing $14,936 since December 31, 2024. […] Our cash and cash equivalents at December 31, 2025 was elevated in anticipation of the consummation of announced transactions. […] In 2025, cash inflows were primarily provided by cash receipts from operations, including cash from our sale and transfer of our receivables to third parties, and the disposition of our investment in DIRECTV.
p. 60 · Read in context →
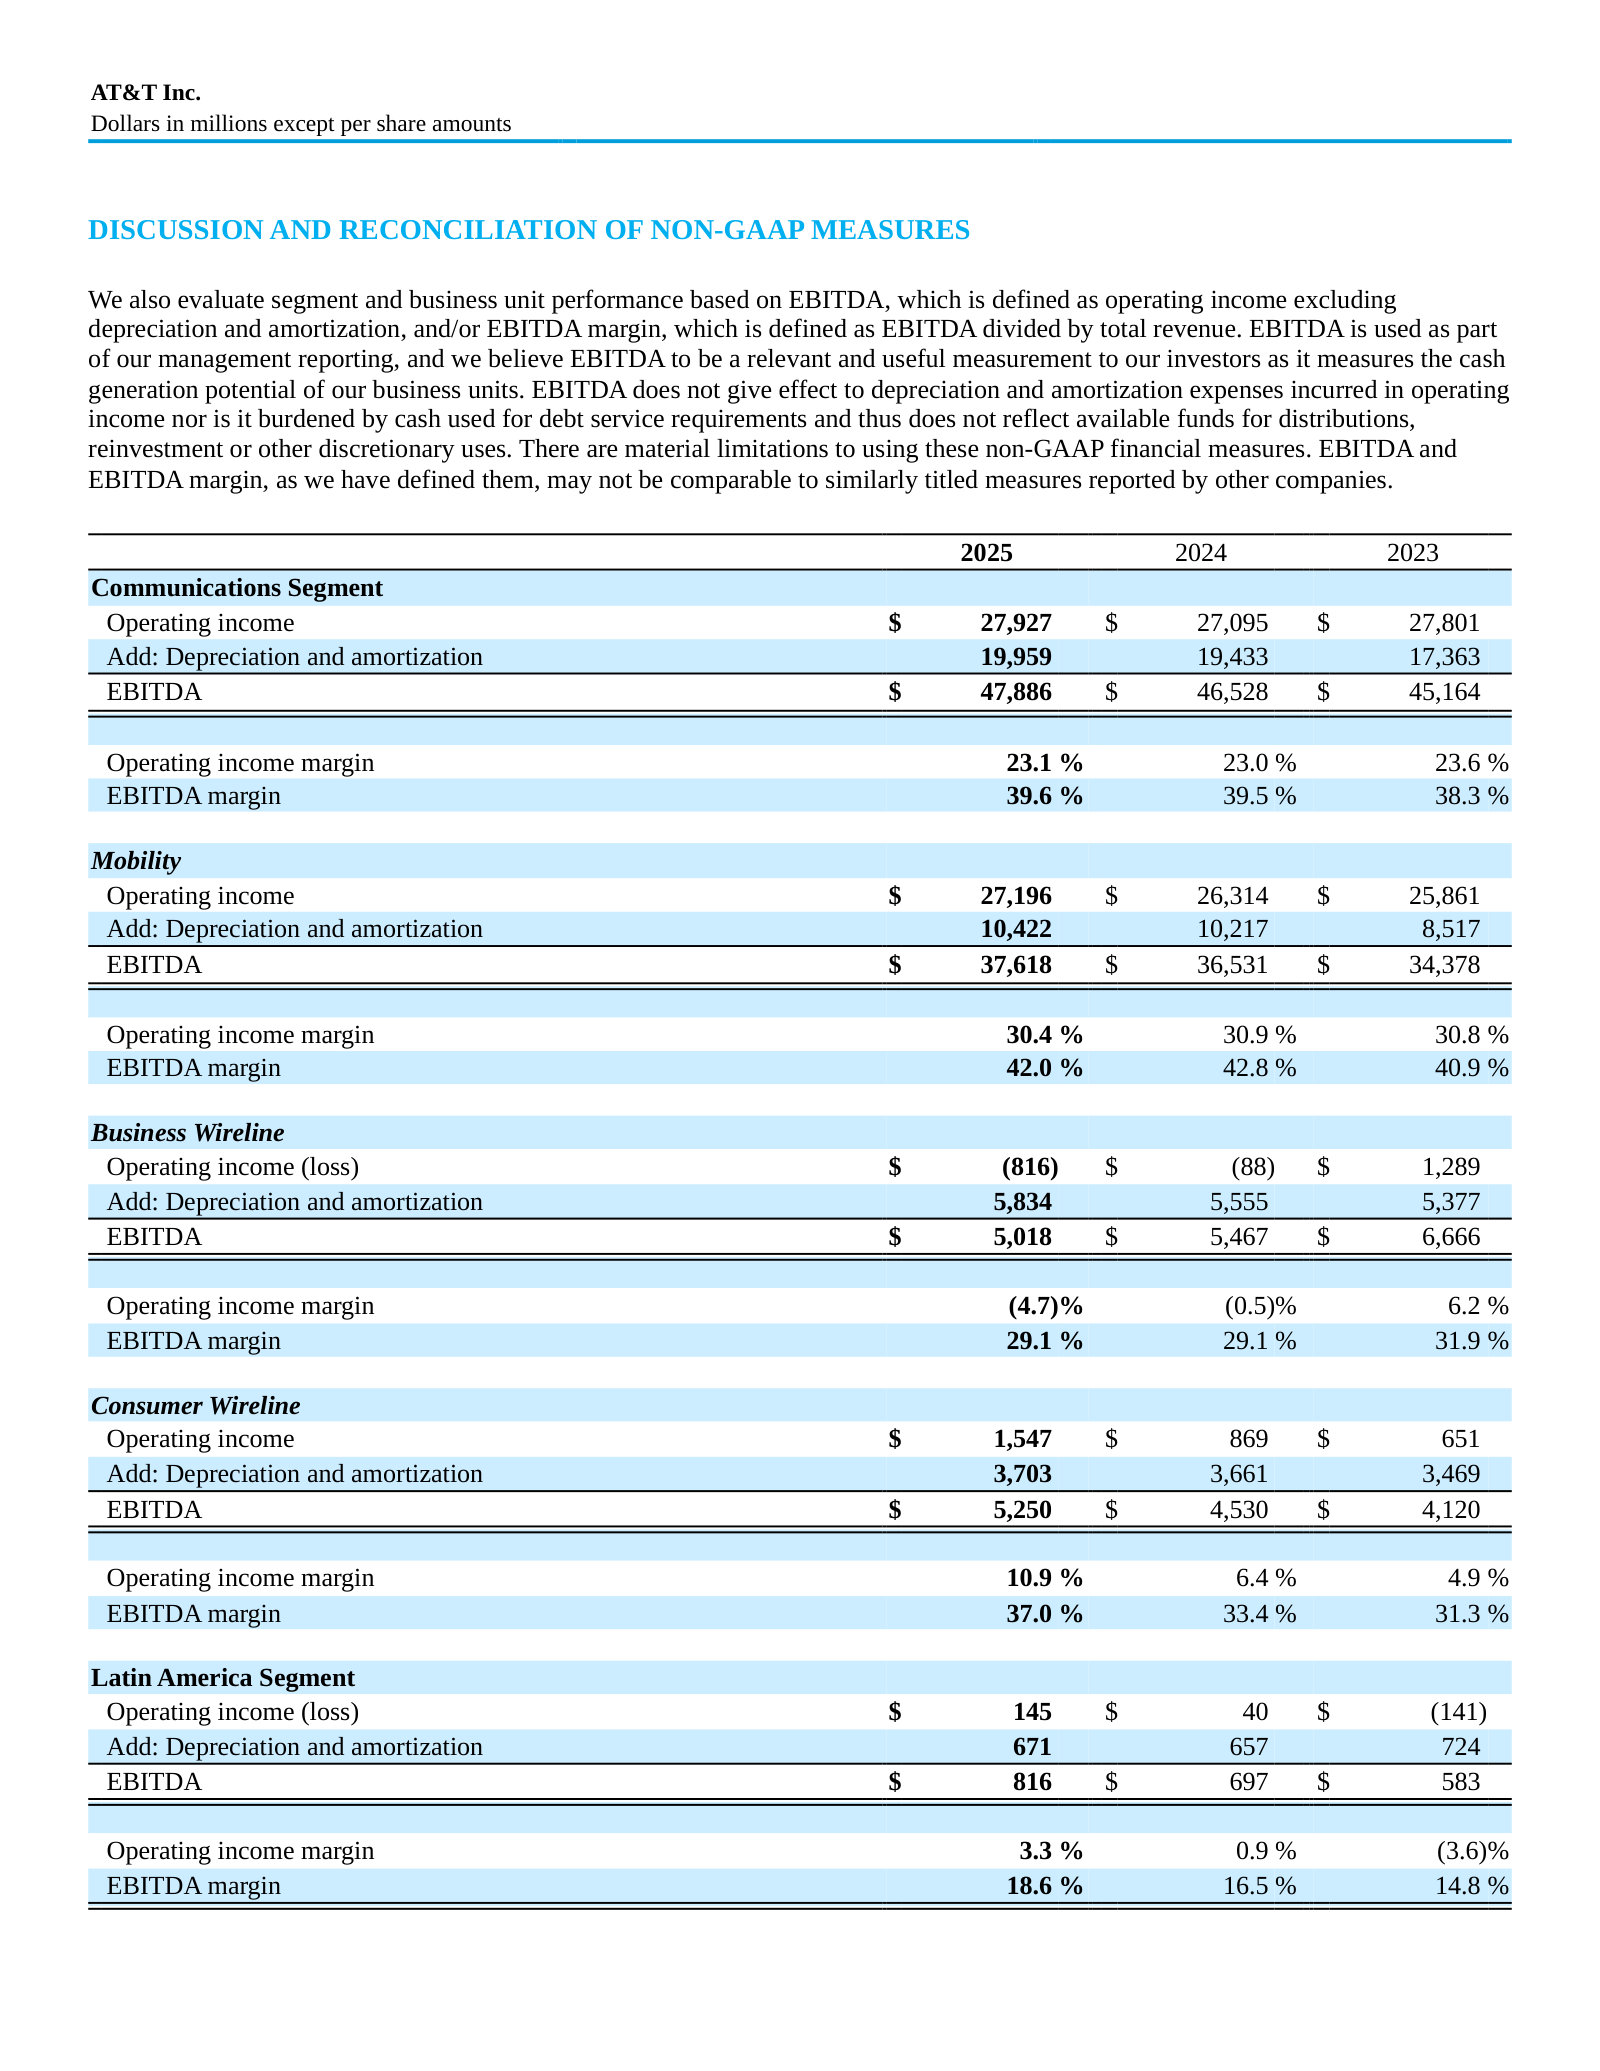
Item 7. MD&A — Discussion and Reconciliation of Non-GAAP Measures — p. 66 · Read the full section →
Business-unit EBITDA shows where the profit is: Mobility ($37.6B) and a recovering Consumer Wireline against a Business Wireline sliding into operating losses.
AT&T Inc. — FY2021 Annual Report (Form 10-K) — FY2021
The 'before' picture: AT&T as a telecom-media conglomerate with WarnerMedia and HBO Max, filed just as the Discovery spin-off that reversed the strategy was being signed. · Open the full document →
Item 1. Business — General (three-segment structure) — p. 5 · Read the full section →
Shows the abandoned strategy in management's own words — a 'telecommunications, media and technology' company, and the WarnerMedia–Discovery deal that unwound it.
AT&T defined as a media-and-technology company, and the May 2021 agreement to combine WarnerMedia with Discovery.
We are a leading provider of telecommunications, media and technology services globally. […] The WarnerMedia segment develops, produces and distributes feature films, television, gaming and other content in various physical and digital formats globally. […] On May 17, 2021, we entered into an agreement to combine our WarnerMedia segment, subject to certain exceptions, with a subsidiary of Discovery, Inc. (Discovery).
p. 6 · Read in context →
Item 1. Business — WarnerMedia Segment — p. 10 · Read the full section →
The scale of the media bet at its peak — ~23% of segment revenue and nearly 74 million HBO Max/HBO subscribers — before it was spun off in April 2022.
More annual reports
AT&T Inc. — FY2024 Annual Report (Form 10-K) — FY2024 · 163 pages · The transition year: a $4.4B Business Wireline goodwill impairment and Open RAN restructuring cut operating margin to 15.6%; first full year of the two-segment structure. · Open →
AT&T Inc. — FY2023 Annual Report (Form 10-K) — FY2023 · 175 pages · First 10-K to add the Item 1C. Cybersecurity disclosure and to account for DIRECTV as an equity-method investment rather than a consolidated business. · Open →
AT&T Inc. — FY2022 Annual Report (Form 10-K) — FY2022 · 181 pages · The pivot year: WarnerMedia spun off in April 2022 and reported as discontinued operations, leaving the Communications and Latin America segments that define AT&T today. · Open →
Source: S&P Capital IQ consensus via Xpressfeed · Generated 2026-07-24.
The tape reads as an earnings-driven upgrade: normalized EPS estimates have climbed roughly 13% for FY2028 over the past six months while revenue forecasts moved less than 2%, and the company has beaten EPS in seven of the last eight quarters with surprises now above 10% as revenue prints within a point or two of consensus. The forward shape is low-single-digit revenue growth carrying about 10-13% annual EPS gains on steady EBITDA and margin expansion. Coverage is deep near-term but thins to a handful of analysts by FY2029.
FY2028 EPS consensus up ~13% over six months while revenue estimates rise under 2%
The gap is widest in FY2028, where the normalized EPS mean rose from 2.575 to 2.91 over 180 days while the revenue mean added only about 1.5%. The last 30-90 day moves are small in both lines.
Currency: USD · Scale: money in millions, absolute · Point-in-time consensus; Δ90d is Now versus 90d.
| Metric | FY | 180d | 90d | 30d | Now | Δ90d |
|---|---|---|---|---|---|---|
| EPS (normalized) | FY2028 | $2.58 | $2.88 | $2.88 | $2.91 | +0.8% |
| EPS (normalized) | FY2027 | $2.45 | $2.56 | $2.55 | $2.57 | +0.4% |
| Revenue | FY2028 | $133.00bn | $135.03bn | $135.12bn | $135.03bn | -0.0% |
| Revenue | FY2027 | $129.30bn | $132.43bn | $132.50bn | $132.05bn | -0.3% |
Normalized EPS beaten five quarters running, surprises widening past 10%, as revenue lands within ~2%
EPS has topped consensus in seven of the last eight quarters; the two largest surprises, +11.6% and +10.7%, are the most recent Q4 and Q2 prints. Revenue surprises stay small and alternate around zero.
Current sequences by metric: Revenue: 1 consecutive miss; EPS (normalized): 5 consecutive beats.
Currency: USD · Scale: money in millions, absolute · Consensus is captured before each actual first became effective.
| Quarter | Metric | Consensus | Actual | Surprise | Outcome |
|---|---|---|---|---|---|
| Q2 FY2026 | Revenue | $31.81bn | $31.56bn | -0.8% | Miss |
| Q2 FY2026 | EPS (normalized) | $0.59 | $0.65 | +10.7% | Beat |
| Q1 FY2026 | Revenue | $31.24bn | $31.51bn | +0.9% | Beat |
| Q1 FY2026 | EPS (normalized) | $0.55 | $0.57 | +3.4% | Beat |
| Q4 FY2025 | Revenue | $32.88bn | $33.47bn | +1.8% | Beat |
| Q4 FY2025 | EPS (normalized) | $0.47 | $0.52 | +11.6% | Beat |
| Q3 FY2025 | Revenue | $30.89bn | $30.71bn | -0.6% | Miss |
| Q3 FY2025 | EPS (normalized) | $0.54 | $0.54 | +0.4% | Beat |
| Q2 FY2025 | Revenue | $30.48bn | $30.85bn | +1.2% | Beat |
| Q2 FY2025 | EPS (normalized) | $0.53 | $0.54 | +1.9% | Beat |
| Q1 FY2025 | Revenue | $30.36bn | $30.63bn | +0.9% | Beat |
| Q1 FY2025 | EPS (normalized) | $0.51 | $0.51 | -0.9% | Miss |
| Q4 FY2024 | Revenue | $31.94bn | $32.30bn | +1.1% | Beat |
| Q4 FY2024 | EPS (normalized) | $0.51 | $0.54 | +6.8% | Beat |
| Q3 FY2024 | Revenue | $30.45bn | $30.21bn | -0.8% | Miss |
| Q3 FY2024 | EPS (normalized) | $0.57 | $0.60 | +5.1% | Beat |
EPS up ~10-13% a year on ~2-3% revenue growth: an operating-leverage story
Revenue compounds in the low single digits while EBITDA margin widens and normalized EPS climbs double digits. Figures are USD millions except per-share EPS.
Currency: USD · Scale: money in millions, absolute · YoY uses the prior fiscal year from the feed; analyst count and range use the first displayed period.
| Metric | FY2025A | FY2026E | FY2027E | FY2028E | FY2029E | YoY | Analysts | Low / high |
|---|---|---|---|---|---|---|---|---|
| Revenue | $125.09bn | $129.29bn | $132.05bn | $135.03bn | $139.42bn | — | 21 | $123.84bn / $126.62bn |
| EBITDA | $46.25bn | $48.13bn | $50.10bn | $52.43bn | $54.44bn | — | 19 | $46.13bn / $46.50bn |
| EPS (normalized) | $2.06 | $2.33 | $2.57 | $2.91 | $3.23 | — | 23 | $2.02 / $2.09 |
The least-settled line is FY2028 EPS: a $2.70-3.18 range across 17 analysts
FY2028 normalized EPS spans $2.70-3.18 across 17 analysts, roughly a 16% spread; FY2029's $3.06-3.49 rests on just 6. The dispute sits in the per-share earnings line more than in revenue.
Currency: USD · Scale: money in millions, absolute · Spread/mean is absolute high-low divided by absolute mean.
| Metric | Period | Mean | Low–high | Spread/mean | Analysts |
|---|---|---|---|---|---|
| EPS (normalized) | FY2028E | $2.91 | $2.70–$3.18 | 16.5% | 17 |
| Revenue | FY2028E | $135.03bn | $132.16bn–$137.59bn | 4.0% | 16 |
| EPS (normalized) | FY2029E | $3.23 | $3.06–$3.49 | 13.3% | 6 |
Street snapshot
Currency: USD · Scale: money in millions, absolute · Analyst counts shown explicitly.
| Street view | Reading | Analysts |
|---|---|---|
| Recommendation mix | Buy 12, Outperform 4, Hold 9, Underperform 0, Sell 1 | 26 |
| Consensus score | 2.00 | 26 |
| Target price | mean $28.71; median $28.00; high $36.00; low $20.00 | 23 |
Back-year tape thins sharply: FY2029 rests on just 4-6 analysts
FY2029 revenue carries 5 analysts, EBITDA 4 and GAAP net income just 2. Treat the FY2029 column as directional rather than settled consensus.
Visible Alpha broker models via S&P Xpressfeed · 20 brokers · 717 line items · freshest revision 2026-07-23.
The street models AT&T as a steady cash compounder: mid-single-digit revenue growth led by Mobility and fiber, with EBITDA and free cash flow modeled higher every year through FY-2028. Consensus on the dollars is unusually tight; the genuine debate lives in subscriber volumes, not the P&L. Coverage is deep and freshly revised (mostly 2026-07-23), though out-year segment splits rest on far fewer brokers than the headline lines.
Free cash flow is the modeled crux — coverage after the dividend widens every year
The cash bridge is the bull case here: EBITDA and FCF step up each year while capital investment stays roughly flat and the dividend is held, so free cash flow after dividends is modeled to climb sharply. Brokers barely disagree on any of it.
| Line | FY-2025A | FY-2026E | FY-2027E | FY-2028E | YoY | Brokers |
|---|---|---|---|---|---|---|
| Cash engine | — | — | — | — | — | — |
| EBITDA | $45.40bn | $47.83bn | $50.07bn | $52.63bn | +5.4% | 15 |
| Cash paid for capital investment | $22.18bn | $23.68bn | $23.68bn | $23.39bn | +6.7% | 16 |
| Free cash flow | $16.37bn | $18.30bn | $19.52bn | $21.63bn | +11.8% | 17 |
| Return | — | — | — | — | — | — |
| Dividends paid | $8.18bn | $7.74bn | $7.31bn | $7.05bn | -5.3% | 18 |
| Free cash flow after dividends | $8.19bn | $10.56bn | $12.22bn | $14.58bn | +28.9% | 17 |
Fiber and fixed wireless are the modeled growth engine, outrunning legacy decline
Fiber revenue and connections compound steadily while AT&T Internet Air (fixed wireless) scales from a standing start. Together they are modeled to more than cover the persistent decline in Business Wireline.
| Line | FY-2025A | FY-2026E | FY-2027E | FY-2028E | YoY | Brokers |
|---|---|---|---|---|---|---|
| Consumer growth | — | — | — | — | — | — |
| Revenue - Consumer wireline/Broadband | $14.25bn | $15.38bn | $16.16bn | $17.83bn | +7.9% | 19 |
| Fiber revenue | $8.72bn | $10.39bn | $11.79bn | $13.26bn | +19.1% | 17 |
| AT&T Fiber connections(K#) | 10.40m Number | 12.86m Number | 14.28m Number | 15.83m Number | +23.7% | 18 |
| AT&T Internet Air revenue | — | $1.44bn | $2.12bn | $2.74bn | — | 15 |
| Legacy drag | — | — | — | — | — | — |
| Revenue - Business wireline | $17.18bn | $16.07bn | $15.16bn | $14.92bn | -6.5% | 19 |
Mobility grinds higher on ARPU as the postpaid net-add pace is modeled to fade
Postpaid phone ARPU creeps up and churn is modeled flat near 0.9%, so Mobility revenue keeps rising even as annual net adds are penciled to decelerate. The volume line is where the models actually diverge (see below).
| Line | FY-2025A | FY-2026E | FY-2027E | FY-2028E | YoY | Brokers |
|---|---|---|---|---|---|---|
| Revenue | — | — | — | — | — | — |
| Revenue - Mobility | $88.90bn | $92.56bn | $95.37bn | $97.70bn | +4.1% | 19 |
| Unit economics | — | — | — | — | — | — |
| ARPU - Postpaid Phones($) | $56.66 | $57.37 | $57.74 | $58.06 | +1.3% | 16 |
| Churn - Postpaid Phones(%) | 0.9% | 0.9% | 0.9% | 0.9% | +0.0pt | 16 |
| Volume | — | — | — | — | — | — |
| Total net adds - Postpaid Phones(K#) | 1.49m Number | 1.50m Number | 1.26m Number | 1.15m Number | +0.7% | 16 |
Where the models split is volume, not dollars — postpaid and broadband net adds
In contrast to the tight consensus on revenue and cash flow, brokers disagree sharply on how many net adds AT&T can keep booking — the FY-2028 postpaid phone range spans a wide band across roughly a dozen brokers.
| Line | Period | Median | Q1–Q3 | Min–max | Brokers |
|---|---|---|---|---|---|
| Total net adds - Postpaid Phones(K#) | FY-2028E | 1.15m Number | 1.00m Number–1.30m Number | 700,000 Number–1.71m Number | 11 |
| AT&T Internet Air - Net adds(K#) | FY-2028E | 825,000 Number | 689,120 Number–900,000 Number | 600,000 Number–1.06m Number | 11 |
| AT&T Fiber - Net adds(K#) | FY-2028E | 1.51m Number | 1.45m Number–1.72m Number | 720,000 Number–2.17m Number | 11 |
Fixed wireless is modeled as a real business, but net adds are penciled to peak and fade
AT&T Internet Air revenue and connections are modeled to keep climbing through FY-2028, but the annual net-add pace is penciled to peak and then ease — the street sees FWA as a genuine broadband layer, not an indefinite growth curve.
Headline coverage is deep and fresh; out-year segment splits are thin
Cash-flow and EBITDA lines carry ten or more brokers and were revised on 2026-07-23, so the aggregate model is current. But out-year segment revenue — Business Wireline and Consumer Wireline especially — thins to a handful of brokers, so read those splits as directional rather than settled.
Headline P&L consensus, momentum and beat/miss live in the CapIQ tab.
Source: S&P Capital IQ transcripts via Xpressfeed · latest indexed call 2026-07-22 · generated 2026-07-24.
Latest call digest
AT&T Inc., Q2 2026 Earnings Call, Jul 22, 2026 · 2026-07-22T12:30:00
Q2 2026 — July 22, 2026. The prepared remarks read as a victory lap on the convergence-and-fiber thesis: AT&T added more than 1 million advanced connectivity subscribers, with fiber, fixed wireless and postpaid phones all up year-over-year, its best-ever second quarter for fiber net adds and a record for combined fiber and fixed-wireless adds. Convergence reached 42.5% of advanced home internet customers (45% excluding the acquired Lumen footprint). Consolidated service revenue grew 2.7%, adjusted EBITDA rose 5.2% to a 39.1% margin (a post-strategy-refocus high), and adjusted EPS of $0.65 was up more than 20% from $0.54. Management reaffirmed full-year EPS of $2.25 to $2.35, $18 billion-plus of free cash flow, and Advanced Connectivity service-revenue growth of 5%-plus. Two items dominated: a 25% increase in the 2026 buyback to roughly $10 billion (framed explicitly as a response to an undervalued stock, pulling forward buybacks planned through 2028), and Stankey's extended argument that agentic AI will reshape network traffic and reward AT&T's fiber-plus-low-band position. He also called the copper turndown a 'tipping point,' with FCC approval to discontinue legacy service in over 30% of wire centers by late 2026, and announced the EchoStar spectrum close by end of July. CFO Pascal Desroches's planned year-end retirement and Jennifer Biry's return as successor were noted.
The Q&A was less about the quarter and more about the edges of the strategy. The hardest exchanges pressed on fiber ARPU, which management conceded is under near-term pressure (flat ex-Lumen, down 1.3% reported) as convergence discounts and lower-ARPU Lumen subscribers dilute the metric — Stankey repeatedly redirected to total account revenue rather than per-product ARPU. Analysts probed whether the Lumen broadband ramp is durable or just pent-up demand, satellite (both as an AST-based 'corner case' fill and as a potential Starlink competitor), device-cost inflation and its effect on churn, and capital allocation priorities. On the buyback-versus-debt-versus-fiber question, management was candid that the raise reflects a valuation view and that the Board will revisit allocation at its September meeting rather than commit further now.
Participant coverage from the latest call.
| Group | Participants | Count |
|---|---|---|
| Management | Operator; Brett Feldman — Senior Vice President of Finance & Investor Relations, AT&T Inc.; John Stankey — CEO, President & Chairman, AT&T Inc.; Pascal Desroches — Senior EVP & CFO, AT&T Inc. | 4 |
| Analysts | Sean Diffley — Equity Analyst, Morgan Stanley, Research Division; John Hodulik — MD, Sector Head of the United States Communications Group and Telco & Pay TV Analyst, UBS Investment Bank, Research Division; David Barden — Head of U.S. Communication Services & Lead Analyst, New Street Research LLP; Craig Moffett — Co-Founder, Founding Partner Senior Managing Director & Senior Research Analyst, MoffettNathanson LLC; Michael Rollins — MD & U.S. Telecoms Analyst, Citigroup Inc., Research Division; Samuel McHugh — Analyst of Telecom Operators & Head of Telecom Equity Research, BNP Paribas, Research Division; Peter Supino — MD & Senior Analyst, Wolfe Research, LLC | 7 |
Curated latest-call exchanges; one row per analyst topic.
| Analyst | Firm | Topic | What changed in Q&A |
|---|---|---|---|
| Sean Diffley | Morgan Stanley | New value-segment plans (Build-A-Plan/OneConnect), fiber back-book pricing, rural satellite economics | Stankey framed the down-market push as accretive new-account growth (a 3-year high in account adds), and defended fiber ARPU dilution as acceptable when it wins converged, longer-lived customers; sees satellite eventually shrinking rural terrestrial footprint. |
| John Hodulik | UBS | Lumen broadband volume ramp and how AT&T monetizes agentic AI traffic | Clarified the '45%' was the Lumen convergence rate, not a sales-rate jump; said monetization runs through a stronger low-band upstream, PON-fed small cells and wireless service differentiation/slicing, drawing a VPN analogy. |
| David Barden | New Street Research | Whether 'corner cases into 2027' implies M&A, and the delayed C-band auction timeline | Ruled out M&A — the corner cases are the ~2% of traffic that walks off-network, to be solved via the AST SpaceMobile direct-to-device partnership; said the long-dated C-band timeline is exactly why AT&T pursued EchoStar spectrum. |
| Craig Moffett | MoffettNathanson | FWA capacity versus AI traffic prioritization; Starlink as an MVNO competitor | Reiterated FWA is not the optimal long-term fixed technology and mobility spectrum takes priority; said AT&T reaches converged customers well on its own and needs a partner only for the 2% it can't serve, not a wholesale deal. |
| Michael Rollins | Citigroup | Churn/upgrade behavior, device-price inflation and subsidies, and capital-allocation priorities | Called churn a multi-factor result helped by suppressed device switching and convergence; expects device costs and therefore prices up and demand down; said the buyback raise reflects a suppressed valuation but the Board decides allocation at its September meeting. |
| Samuel McHugh | BNP Paribas | Advanced home internet revenue running below the ~30% target while wireless outperforms; fiber ARPU deceleration | Stankey accepted product-level trade-offs as long as total account revenue grows; Desroches reaffirmed 5%-plus Advanced Connectivity service-revenue guidance and flagged broadband could come in a touch light with wireless a touch higher. |
| Peter Supino | Wolfe Research | Industry churn stabilization and consumer sensitivity to the April price increase | Stankey attributed 2025's elevated churn to stepped-up promotion as LTVs improved, said the industry has since rationalized, and expects the back half to look much like the current quarter. |
Theme tracker
Themes are curator-classified across supplied calls.
| Theme | Status | Quarters mentioned | Read-through |
|---|---|---|---|
| Fiber-plus-wireless convergence | persisted | Q3 2023, Q4 2023, Q2 2024, Q3 2024, Q4 2024, Q2 2025, Q3 2025, Q4 2025, Q1 2026, Q2 2026 | The consistent organizing thesis across the whole history; management moved from 'where we build fiber, we win' language to a specific convergence rate (42.5% in Q2 2026) as the headline metric, arguing it lowers churn and raises lifetime value. |
| Fiber build acceleration and passings targets | persisted | Q3 2023, Q4 2023, Q3 2024, Q1 2025, Q2 2025, Q4 2025, Q1 2026, Q2 2026 | The target escalated over time — from 30 million-plus by end-2025 to 50 million-plus by 2029 to 60 million-plus by 2030 (including Lumen), with build pace ramping toward 4 million locations a year. |
| Copper / legacy network retirement | persisted | Q3 2023, Q4 2023, Q4 2024, Q2 2025, Q3 2025, Q4 2025, Q1 2026, Q2 2026 | A slow-burn theme that gained urgency with supportive FCC action; by Q2 2026 management called it a 'tipping point' with approval to discontinue legacy service in over 30% of wire centers. |
| Capital returns / share buybacks | persisted | Q4 2024, Q1 2025, Q2 2025, Q4 2025, Q1 2026, Q2 2026 | Emerged as a distinct pillar with the Q4 2024 $40 billion-plus, three-year return plan once the 2.5x leverage target was in sight; the buyback figure was repeatedly revised upward, reaching a raised ~$10 billion for 2026. |
| Business Wireline weakness as a standalone concern | dropped | Q3 2023, Q4 2023, Q1 2024, Q2 2024, Q3 2024 | For roughly two years legacy-voice-driven Business Wireline declines drew repeated guidance cuts and a Q3 2024 goodwill impairment; the topic effectively disappeared as a standalone discussion after the Q1 2026 move to Advanced Connectivity / Legacy segment reporting folded it into the broader Legacy bucket. |
| Agentic-AI-driven network demand | emerged | Q4 2025, Q2 2026 | A newer forward-looking pitch that dense metro fiber and low-band spectrum position AT&T for AI traffic growth; still narrative rather than a quantified revenue driver. |
| Tariffs / macro visibility | dropped | Q1 2025, Q2 2025 | Surfaced sharply in Q1 2025 around reduced visibility and device-cost risk, lingered into Q2 2025, then faded from the narrative through 2026 as guidance was reaffirmed and raised. |
Guidance ledger
Quotes, calls, and speakers are source-verified; outcomes are curator-classified.
| Verbatim guidance | Call | Speaker | Curator outcome | Outcome note |
|---|---|---|---|---|
| “We're also on track to pass 30 million-plus fiber locations by the end of 2025.” | AT&T Inc., Q3 2023 Earnings Call, Oct 19, 2023 · 2023-10-19T12:30:00 | John Stankey | kept | AT&T reported 32 million fiber locations at the end of 2025 on the Q4 2025 call, clearing the long-standing target. |
| “Our adjusted EPS guidance for 2025 of $1.97 to $2.07” | AT&T Inc., Q4 2024 Earnings Call, Jan 27, 2025 · 2025-01-27T13:30:00 | Pascal Desroches | kept | Full-year 2025 adjusted EPS came in at $2.12 (Q4 2025 call), above the guided range. |
| “Our guidance for $16 billion-plus of free cash flow this year” | AT&T Inc., Q4 2024 Earnings Call, Jan 27, 2025 · 2025-01-27T13:30:00 | Pascal Desroches | kept | Full-year 2025 free cash flow was $16.6 billion, within the '$16 billion-plus' guide. |
| “we continue to expect full year growth in service revenues in the higher end of the 2% to 3% range and EBITDA in the higher end of the 3% to 4% range” | AT&T Inc., Q4 2024 Earnings Call, Jan 27, 2025 · 2025-01-27T13:30:00 | Pascal Desroches | missed | This referred to Mobility; on the Q2 2025 call management lowered the Mobility EBITDA outlook to approximately 3% growth on higher growth-related spending. |
| “For 2026, we expect free cash flows of $18 billion plus” | AT&T Inc., Q4 2025 Earnings Call, Jan 28, 2026 · 2026-01-28T13:30:00 | Pascal Desroches | pending | Reaffirmed on both the Q1 2026 and Q2 2026 calls; H1 2026 free cash flow tracked ahead, with Q2 free cash flow of $4.7 billion above its guidance range. |
| “including approximately $8 billion of buybacks in 2026.” | AT&T Inc., Q4 2025 Earnings Call, Jan 28, 2026 · 2026-01-28T13:30:00 | Pascal Desroches | pending | Raised on the Q2 2026 call to approximately $10 billion, a roughly 25% increase and a pull-forward of buybacks planned through 2028. |
Q&A pressure map
Question counts and firms are curator tallies; analyst coverage shown above.
| Topic | Questions | Firms | Pressure / response |
|---|---|---|---|
| Fiber ARPU and broadband back-book pricing | 5 | Morgan Stanley, BNP Paribas, Wolfe Research, UBS | Analysts repeatedly pressed on how AT&T sustains broadband revenue while fiber ARPU decelerates under convergence discounts and Lumen dilution; management consistently redirected to total account revenue rather than per-product ARPU. |
| Capital allocation — buybacks vs. debt reduction vs. fiber | 4 | Citigroup, Goldman Sachs, Morgan Stanley, BofA Securities | A recurring push on buyback pace, any minimum floor, and priorities; management reaffirmed commitments but declined to give a buyback floor (Q1 2025) and deferred the Q2 2026 allocation decision to a September Board meeting. |
| Satellite / direct-to-device — threat and partnership | 4 | MoffettNathanson, New Street Research, Morgan Stanley, Citigroup | Questions spanned Starlink as a potential MVNO competitor, the AST SpaceMobile 'corner case' fill, and LEO threats to fixed and mobile; management positioned satellite as a partner for the ~2% off-network traffic, not a wholesale necessity. |
| Wireless churn and promotional intensity | 4 | Wolfe Research, Citigroup, UBS, Deutsche Bank | Persistent probing on whether elevated 2025 switching would recur and how price increases affect churn; management tied stable churn to convergence and cohort management rather than to any single lever. |
Language shifts
Only language evidence verified against the referenced component is shown.
| Observation | Verbatim evidence | Call ID | Component |
|---|---|---|---|
| Early-2024 caution flagged the Business Wireline transformation as non-linear, an unusual admission amid otherwise upbeat remarks. | “Our Business Wireline operations transformation will not be a linear process.” | 1872512285 | 2 |
| Q1 2025 introduced explicit macro-visibility caution around tariffs and administration policy — new risk vocabulary versus the confident 2024 tone. | “all companies in the U.S. are now operating with less visibility as the administration pursues policies” | 1934602012 | 2 |
| By Q2 2025 the register swung to unusually strong confidence, invoking a decades-long comparison for policy tailwinds. | “Investment and policy tailwinds are as strong as I can remember since maybe the Telecommunications Act of 1996.” | 1945593301 | 2 |
| Q2 2026 leaned into a forward AI-network narrative, framing agentic AI as a structural change in traffic — a newer thematic vocabulary. | “The rise of agentic AI is fundamentally reshaping network traffic, not just in volume, but in shape, symmetry and criticality.” | 2002878658 | 2 |
| On copper, management shifted from multi-year 'orderly turndown' language to declaring an inflection had been reached. | “In my view, we've now reached the tipping point and that goal is firmly in sight.” | 2002878658 | 2 |
The twelve-call arc shows a management team that largely delivered on the numeric commitments it can control — fiber passings, 2025 EPS and free cash flow — while steadily escalating fiber and capital-return targets; the open questions the calls surface are less about execution than about fiber ARPU dilution, the durability of convergence-led churn, and how much of the AI-network thesis converts into revenue rather than narrative.
Competitors describe AT&T Inc.'s market in their own filings and calls. These verified passages and visual pages show where their strategies meet, using source documents preserved in Sources.
Verizon Communications Inc. (VZ)
AT&T's closest rival across wireless, fiber broadband and fixed wireless; the Frontier acquisition sharpens its convergence push.
Verizon's 10-K names AT&T among its principal national wireless competitors
we compete against other national wireless service providers, including AT&T Inc. and T-Mobile US, Inc., as well as various regional wireless service providers.
p. 8 · Read in context →
Verizon frames the Frontier fiber deal and convergence as the lever to grow wireless share
Anthony Skiadas — Chief Financial Officer: We now have approximately 16.8 million broadband subscribers. We are confident in the long-term success of our broadband strategy. Frontier accelerates our opportunity to grow our broadband subscribers as well as our converged offerings, a key enabler to growing wireless share in underpenetrated Frontier markets.
p. 4 · Read in context →
CEO on the competitive field and the industry's annual postpaid growth pool
Daniel Schulman — Chief Executive Officer: Both AT&T and T-Mobile are excellent companies. I have a ton of respect for both of them and their companies. But I feel like there's still plenty of room for growth in this industry. And on how you count it, somewhere between 5 million and 8 million new postpaid subs that enter into the industry every year.
p. 9 · Read in context →
T-Mobile US, Inc. (TMUS)
The wireless share leader now attacking AT&T's home-broadband base with fixed wireless and fiber joint ventures.
T-Mobile lists AT&T first among its wireless competitors and ranks itself second by customers
We are the second largest provider of wireless communications services in the U.S. as measured by our total postpaid and prepaid customers. Our wireless communications services competitors include other carriers, such as AT&T Inc. (“AT&T”) and Verizon Communications, Inc. (“Verizon”).
p. 8 · Read in context →
CEO claims T-Mobile's existing customers pay 12–15% less than AT&T and Verizon
Srini Gopalan — Chief Executive Officer: Our existing customers pay between 12-15% lower than AT&T and Verizon's. That is a massive factor in terms of the flexibility it gives us.
p. 3 · Read in context →
CEO frames strategy as attacking incumbents in fiber and fixed wireless, not buying scale
Srini Gopalan — Chief Executive Officer: We see our strength as attacking incumbents rather than becoming an incumbent. We see a huge opportunity to attack incumbents across fiber and fixed wireless access. That will be our key play.
p. 8 · Read in context →
Comcast Corporation (CMCSA)
Cable incumbent competing with AT&T in broadband (Xfinity) and wireless (Xfinity Mobile), exposed to AT&T's fiber overbuild and fixed wireless.
Comcast's 10-K names AT&T among telcos overbuilding its footprint with fiber
Certain wireline telecommunications companies, such as AT&T, Lumen and Verizon in the United States and BT and Virgin Media O2 in the United Kingdom, have built and are continuing to build fiber-based wireline network infrastructure further into their networks, which enables them to provide data transmission speeds that exceed those that can be provided with traditional copper digital subscriber line (“DSL”) technology
p. 11 · Read in context →
Co-CEO cites a third-party ranking placing Xfinity ahead of AT&T on network measures
Michael Cavanagh — Co-CEO: Opensignal recently ranked Xfinity the top provider in our footprint, outperforming Verizon, T-Mobile, and AT&T in reliability, download speeds, and streaming.
p. 2 · Read in context →
Comcast's view of a broadband endgame of two multi-gig providers, with fixed wireless a durable competitor
Michael Cavanagh — Co-CEO: we believe that the vast majority of the broadband market will be comprised of 2 multi-gig symmetrical providers serving most addresses […] we expect most of our footprint will eventually be overbuilt. At the same time, fixed wireless remains a durable competitor, serving price-sensitive segments with moderate performance needs.
p. 1 · Read in context →
Charter Communications, Inc. (CHTR)
Spectrum competes with AT&T in broadband and mobile and quantifies its exposure to AT&T fiber and fixed-wireless overbuild.
Charter names AT&T and Verizon as its primary fiber competitors and sizes the overlap
AT&T Inc. (“AT&T”) and Verizon are our primary FTTH competitors. We face terrestrial broadband Internet (defined by the Federal Communications Commission (“FCC”) as at least 100 Mbps) competition from AT&T and Verizon in approximately 27% and 16% of our operating footprint, respectively.
p. 27 · Read in context →
Charter says AT&T, Verizon and T-Mobile are pursuing converged connectivity “similar to ours”
AT&T, Verizon and T-Mobile continue to expand 5G mobile services, and consolidations in the telecom industry continue to increase competition as they seek to offer converged connectivity services similar to ours.
p. 27 · Read in context →
CEO on AT&T's fixed-wireless expansion into Charter's broadband territory
Chris Winfrey — President and CEO: Yes, we see continued footprint expansion from cell-phone Internet where AT&T has filled that gap with a fixed wireless access product that originally they said they didn't think made a lot of sense.
p. 9 · Read in context →
EchoStar Corporation (SATS)
EchoStar's Boost Mobile is the fourth U.S. carrier, competing with AT&T for wireless subscribers while leaning on AT&T's network as a host.
EchoStar's 10-K casts AT&T among the scale-advantaged nationwide carriers it competes against
We compete with a number of national wireless carriers, including Verizon, AT&T and T-Mobile, all of which are significantly larger than us, serve a significant percentage of all wireless subscribers and enjoy scale advantages compared to us as the only nationwide MNOs in the United States.
p. 16 · Read in context →
EchoStar notes AT&T is both its network supplier and a competitor
We are able to offer wireless services to our customers through our Hybrid MNO, and through our existing agreements with AT&T and T-Mobile, both of whom are competitors of ours.
p. 39 · Read in context →
Lumen Technologies, Inc. (LUMN)
Enterprise and fiber rival to AT&T Business; it is selling its consumer fiber to AT&T and pivoting to AI-era connectivity.
Lumen agrees to sell its 11-state consumer fiber business to AT&T
On May 21, 2025, we entered into a definitive agreement to sell our Mass Markets Fiber-to-the-Home business in 11 states (the “Territory”) to AT&T.
p. 5 · Read in context →
Lumen's pivot to enterprise, where it collides with AT&T Business
Kathleen Johnson — President and CEO: While we still contend with declining legacy telecom revenue, our growing revenue base now accounts for 50% of North American enterprise revenue, up from 35.5% just three years ago.
p. 1 · Read in context →
More peer documents
Verizon Q4 FY2025 earnings call — Q4 FY2025 · 11 pages · Broadband share gains of 372k net adds and FWA capacity to grow in underpenetrated Frontier markets. · Open →
T-Mobile Q2 FY2025 earnings call — Q2 FY2025 · 14 pages · Management on gaining share as the leader in smaller markets and rural areas, plus fixed-wireless growth. · Open →
Comcast Q1 FY2026 earnings call — Q1 FY2026 · 11 pages · Management triangulates fiber, fixed wireless and satellite broadband competition. · Open →
Charter Q3 FY2025 earnings call — Q3 FY2025 · 13 pages · Winfrey singles out AT&T as the new fixed-wireless entrant pressuring broadband gross adds. · Open →
EchoStar Q3 FY2025 earnings call — Q3 FY2025 · 11 pages · Ergen on using AT&T's network and deploying C-band spectrum to become more competitive. · Open →
Lumen Q2 FY2025 earnings call — Q2 FY2025 · 11 pages · Sizes the $15B multi-cloud networking market and the hyperscaler AI-connectivity strategy that collides with AT&T Business. · Open →
EchoStar FY2024 Form 10-K — FY2024 · 227 pages · Prior-year competition section listing AT&T among the only nationwide MNOs, for year-over-year continuity. · Open →
The answer
Does not fit the framework (P1 not met); contested: P4c, P5.
AT&T clears the universe and trips no exclusion, but the year-10 durability gate (P1) is the pure binary in this system, and the jury returned it not met: revenue-higher-in-a-decade is a high-conviction call, but adjusted free cash flow materially higher with very high conviction is not, and any proper doubt fails the gate. That gate is decisive — nothing downstream offsets it. Confidence is low: the name-masked re-run flipped P1 to met and the load-bearing probability diverged past 0.20, so the run also carries a prior-driven-risk flag. Two criteria are contested (P4c, P5).
Universe and exclusions — the clean screen
Nothing here disqualifies AT&T, and no softening is needed because there is nothing to soften. Both universe lines pass and all five exclusion screens come back clean; the honest counter-facts sit inside each check rather than hidden from it.
AT&T is a Delaware-incorporated US holding company whose common stock lists on the NYSE under ticker "T" — a domestic issuer, not a Chinese company or ADR [1][2]. Market capitalization is about $164.8B — 7.179B shares at the 2026-07-23 close of $22.96 — roughly sixteen times the framework's $10B floor. The universe verdict is met on both lines.
The exclusions do not fire. The auto value-trap screen is inapplicable — this is a telecom carrier, not a vehicle maker. The darling screen passes: at ~1.3x sales ($164.8B / $125.6B) and ~7.6x earnings AT&T is a low-multiple income name, not a bottom-left-to-top-right story [3]. China dependence is absent — revenue is earned in the US and Mexico (~3% of segment revenue), with no customer above 10%. The promotional-CEO screen passes on promise-versus-delivery: four of five 2023–24 commitments were kept (fiber 32M vs a 30M+ target, 2025 FCF $16.6B vs $16B+, leverage to the 2.53x target) — though the counter-fact belongs on the record: the prior-management DirecTV (~$49B) and Time Warner (~$85B) deals destroyed value, raised the share count, and forced the 2022 dividend cut [4]. The structural-decline screen is the closest call: legacy copper is in genuine secular decline and Business Wireline revenue fell 8.4% to $17.2B in 2025 and now runs an operating loss — but that pocket is under 14% of consolidated revenue and is being deliberately decommissioned, and the three-consecutive-year decline disqualifier reads two decline years, not three [5][6].
Pattern match
Of the framework's four recognition lenses, AT&T comes nearest to the high dividend yield plus high FCF yield, business not going away setup: a 4.8% dividend and a ~10% reported FCF yield on an essential, capital-heavy oligopoly. It is not the healthcare/insurance forecasting-error pattern, and that distinction cuts against the setup rather than for it: there was no short-term earnings cut for the market to anchor to. Over the drawdown, forward EPS estimates rose (FY2027 +4.6%, FY2028 +12.8%) and AT&T beat consensus every quarter, so what repriced was terminal value, not near-term earning power [7]. It is not a quality-tech-monopoly dip and not a large-bank cyclical. The pattern it best resembles is the one whose whole case turns on the yield — and the yield is exactly where the framework's own arithmetic falls short (see the pillar ledger and Yield).
The pillar ledger
The tally's per-criterion verdicts, the reference line each sits against, and the deciding arithmetic. Reference lines, never grades.
Source: ruchir/fit_tally.json and the surviving tab claims; figures cited in the treatments below.
Year-10 durability gate (P1) — the decisive result
Here is the decisive point. The gate is binary by construction, and the jury did not clear it. Revenue-higher-in-a-decade is a very-high-conviction call: AT&T sits inside a three-carrier, FCC-licensed facilities-based oligopoly on a ~$260B network-and-spectrum base — net PP&E $131.6B plus net licenses $128.1B — that a competitor cannot cheaply replicate, with postpaid phone churn under 1% and a base that grew three straight years [8][9][10].
What the gate does not clear is the cash leg. The strongest surviving counter-fact, in the same breath: reported free cash flow has been stable but flat — roughly $14–18B every year since 2022, not rising — while capex ran 16.6% of revenue ($20.8B), net debt is ~$118B, a ~$23B EchoStar spectrum purchase is pending, and cable's two leaders added ~3.4M wireless lines in 2025 against AT&T's 1.47M, pressing the wireless ARPU that funds the enterprise [11][12]. "Adjusted FCF materially higher, with very high conviction" is the phrase under real strain, and under this gate strain is enough: three of four jurors returned not met (one met), trimmed-mean probability 0.675 with a 0.14 spread. The name-masked re-run flipped to met — that divergence is why the run flags prior_driven_risk and why confidence is low. The full treatment is in Durability. P1 not met sends the overall verdict to does not fit; no other pillar offsets a failed gate.
Consistency (P2) — met
Reported FCF held a $14.1–17.6B band with no negative years since the 2022 WarnerMedia exit, so the cash is predictable, not merely large [13]. The counter-fact carried in the same treatment: the series has definitional seams — 2024's $17.6B included ~$2.3B of since-excluded DirecTV distributions, so like-for-like 2024 was $15.3B and 2025's $16.6B is the growth — and fit_features.fcf_stability is empty with adjusted_fcf.latest_adjusted null, so P2 is evidenced on reported, not adjusted, FCF (derived: fit_features.fcf_stability). Detail in Yield.
Dislocation and fear gauge (P3a, P3b) — met, with a soft edge
A genuine dislocation exists: AT&T fell 30.9% peak-to-trough, from $29.62 (2025-09-15) to $20.48 (2026-07-01), now $22.96 (derived: fit_features.capitulation_gauge.drawdown). P3a is met. But the counter-fact is structural: the only company-documented trigger is a merely in-line Q3 FY2025 quarter that began leg 1; the far deeper leg 2 rests on press and sell-side drivers (a satellite-competition scare, an Oppenheimer downgrade, Russell index exclusion, a CFO departure), not a filed adverse event. The fear gauge (P3b) is met but muted: the peak volume spike measured 2.37x the pre-fall median, short of AT&T's own 4–5x historic panic days, though turnover did surge into the trough (~85M shares/day in July vs a ~33M pre-peak median) — mechanical selling at the low more than violent capitulation (derived: fit_features.capitulation_gauge.volume_spike). Full anatomy in Dislocation.
Adjusted yield and reversion (P3c, P3d) — the yield fails, the path is only probable
On the framework's only sanctioned basis — adjusted FCF = reported FCF − stock-based comp − the 5-year average of acquisitions — AT&T yields 5.0% against the 10% moderate bar, roughly 500 basis points short, about half the bar. The reported 10.1% ($16.6B / $164.8B) clears the bar only by ignoring the spectrum spend, and the entire gap is that spend: SBC is trivial (~$0.5B), while the trailing five-year acquisition average (~$7.9B) is ~90% the one-time 2021–22 C-band super-cycle [14][15][16]. Adjusted FCF = 16,600 − 536 − 7,871 = $8,193M; 8,193 / 164,830 = 5.0% (derived: fit_features.adjusted_fcf; fit_features.market_cap). This is the balance-sheet-appropriate bar: at 2.53x net debt to adjusted EBITDA AT&T is a moderate name, so the 10% line applies — not the fortress ~8–9% and not the levered 25% [17].
The reversion path (P3d) is met but only probable: consensus and management see reported FCF growing to ~$22B by 2028–29, carrying the framework-adjusted yield across 10% around 2028 (10.1%), which the trimmed-mean probability puts at 0.57 (spread 0.02) — the tightest agreement in the run [18]. The counter-fact: the crossing requires spectrum/M&A not to re-accelerate beyond the ~$23B EchoStar close, and a fresh C-band-scale auction would reset the trailing average and push the crossing past 2029. Workings in Yield.
Balance sheet and self-help (P4a, P4b, P4c) — outlast met, repurchases met, dividend contested
AT&T can outlast the problem without capital allocation being forced to debt paydown (P4a met): net debt ~$117.9B is 2.53x adjusted EBITDA against a 3.75x covenant, no pre-2031 maturity year exceeds ~$9B against ~$40B of operating cash flow, and $18.2B cash sits alongside undrawn facilities [19][20]. The counter-fact: the EchoStar close lifts leverage to ~3.2x before returning to the 2.5x range over ~three years, and refinancing 4.2% paper into 5.0–5.2% paper is a slow drag on free cash flow [21][22].
The repurchase engine clears the framework's hard-fail (P4b met): the share count is falling, not rising — 7.59B (2022) to 7.18B (2025), a −0.8% five-year CAGR, rising=false — and buybacks are now executed, $4.5B in 2025 and ~$10B planned for 2026 [23](derived: fit_features.share_count_trend). The counter-fact: the engine is only two years old, 2025 repurchases were done at ~$27.0/share (above today's $22.96), and the count rose ~23% from 2016–2022 on serial M&A.
P4c (dividend safety) is contested. The jury split evenly (all four jurors reading it contested). The two readings: the 4.8% dividend is well covered — $8.18B paid in 2025 against $16.6B FCF is ~2.0x cover — and management commits to hold it through 2028; against that, AT&T rebased the payout 47% (from $2.08 to $1.11) in 2022, so its record through stress is a recent cut then a hold, and 2026's ~$18B of dividends-plus-buybacks is essentially 100% of the FCF guide, leaving little room if FCF slips [24][25][26]. The report carries both readings without picking one. Detail in Self-Help.
Diagnosis (P5) — contested
P5 is contested. The temporary-or-permanent question is decided by the profile's blind adversarial trial, and the trial returned a contested ruling: three judges put the probability the impairment is temporary at 0.64, with per-judge readings of 0.64, 0.43 and 0.68 (spread 0.25) and a reading-order footprint (temporary-first 0.64 vs permanent-first 0.555 mean, gap 0.085). The temporary reading is more likely but far from settled — the permanent terminal-value reset (a ~$23–24B/yr reinvestment burden, EchoStar leverage to ~3x, and management's own two markdowns of the Business Wireline profit pool — $24.8B in 2022 and the full $4.4B of Business Wireline goodwill in 2024 on "lower long-term projected future cash flows") commands meaningful weight [27]. The Damage Math tab presents both cases and reports the 0.64 ruling without overriding it.
Instrument context (I1) — exists
Qualifying long-dated options exist: the expiration ladder runs to LEAPS dated January 21, 2028 (~18 months out), liquidity is high, and 30-day implied volatility was ~28% as of 2026-07-23 — inside the framework's up-to-~50–55 acceptable band and nowhere near 60–70. By the framework's own logic the name is expressible on the book rather than routed to a watchlist for want of instruments. The counter-fact: these facts rest on dated third-party web sources (AlphaQuery IV, a Nasdaq LEAPS article, Yahoo/Barchart chains), not a filed document, and IV can move quickly around the EchoStar close. Facts-only treatment in Clock.
What a 3x-in-3-years would require
The framework's target test — the price at the bar-yield on normalized adjusted FCF, and what consensus would have to concede — cannot be rendered here as the tally intends: re-rating math unavailable because the applicable bar or normalized adjusted FCF is missing. The adjusted-FCF series the computation needs is not_computable in this run (SBC missing for FY2016–2017; no complete consecutive five-year acquisition window), so the tally records no bar, no normalized_adjusted_fcf, and no implied market cap at the bar.
What is computable frames the same test at its edges. On the framework's adjusted basis the yield sits at 5.0% against the 10% bar — the gap the price would have to close is roughly a doubling of the adjusted yield, which the run's own path (P3d) reaches only around 2028 and only at ~57% probability, contingent on spectrum spend normalizing. And the base rate from the name's own history (Clock): the three completed same-depth drawdowns since the 2021 top recovered their pre-drawdown high on a total-return basis in 1.1 to 3.2 years from the trough — but two earlier 30%+ peaks (July 2016 −37.1%, November 2019 −32.4%) have never been reclaimed, which is the deserved-dislocation cautionary case.
Source: derived from daily price history 1990–2026, dividend/spin-adjusted (derived: fit_features.capitulation_gauge); the two open episodes remain unreclaimed as of July 2026.
Contested and undetermined
Two criteria are contested; nothing was returned cannot-determine.
- P4c (dividend safety) — the two readings above: 2.0x FCF cover and a stated hold-through-2028 commitment, against a 47% rebase in 2022 and a 2026 return plan near 100% of the FCF guide. Jury split: all four jurors contested.
- P5 (diagnosis) — temporary vs permanent, ruled at p_temporary 0.64 but contested (per-judge 0.64 / 0.43 / 0.68, spread 0.25; order-stability gap 0.085). Both readings are carried; the permanent reset holds real weight.
Provenance
Source: ruchir/fit_tally.json (provenance, mask_divergence, skeptic_counts) and ruchir/trial/tally.json.
Two model families sat the jury; a fifth, name-masked run re-scored the same evidence to catch verdicts driven by the ticker rather than the facts. Here that probe fired on the one criterion that matters most — the P1 gate flipped from not met (named) to met (masked) — so the run reports low confidence and a prior-driven-risk flag, meaning the gate verdict was pressed hard and did not settle cleanly. The skeptic recomputed the sixteen verdict-critical claims from their cited figures; all sixteen survived, none were refuted.
The falsifier ledger
The standing what-would-change-this conditions. The framework seeds, then the name-specific thresholds and windows from the run.
Framework seeds:
- adjusted FCF or EBITDA declines where flat-or-better was underwritten
- revenue declines for a third consecutive year
- capital allocation pivots to debt paydown over repurchases
- share count inflects upward
- the industry repricing cycle fails to materialize where industry-wide mean reversion was underwritten
Name-specific:
- Q3/Q4 2026 guidance cut: FY FCF below $18B or adjusted EPS below $2.25 — real consolidated earning-power loss, not a mix effect.
- Postpaid phone net adds turn negative or churn rises materially over 2-3 quarters, reversing the Q2 2026 gain and confirming share loss.
- A NEW impairment tied to lower long-term CONNECTIVITY (not just legacy wireline) cash flows, or leverage stuck above 3x post-EchoStar forcing FCF below guide.
- Wireless service-revenue growth decelerates below ~1% or ARPU declines, breaking the pricing-power basis of EBITDA growth.
- FY2027-FY2028 results deliver at least $19B/$21B of FCF with net debt/adjusted EBITDA returning toward 2.5x after EchoStar while capital investment stays within the $23-$24B range.
- Legacy revenue declines slow to low single digits and Legacy EBITDA margin stabilizes above 40% by Q4 2027.
- Advanced Connectivity sustains 5%+ service revenue growth and 6%+ EBITDA growth while postpaid phone net adds remain positive and churn does not rise materially.
- No further goodwill, license, or network-asset impairment is recorded through FY2028 for lower long-term connectivity cash flows.
- Q3/Q4 2026 guidance cut: FY FCF below $18B or adjusted EPS below $2.25.
- Mobility postpaid phone net adds turn negative or churn rises materially — impairment spreading from legacy into the dominant wireless engine.
- Consolidated adjusted EBITDA turns negative YoY, or a new goodwill/license impairment tied to lower connectivity cash flows lands through FY2028.
- EchoStar + $23-24B capex keep net-debt/EBITDA above 3x and block FCF from reaching ~$21B by 2028, confirming reinvestment permanently caps per-share NPV.
Data gaps
What the run could not answer, from the tally's list:
fit_features.adjusted_fcf/adjusted_fcf_yield/yield_baseline/float_retirement_yearsarenot_computable— SBC is missing for FY2016–2017 and there is no complete consecutive five-year acquisition window, so the framework's adjusted "real" FCF (the canonical yield basis, and the input the re-rating math needs) was rebuilt from filed cash-flow statements and the SBC note rather than taken from the feed.fit_features.revenue_trajectoryisnot_computable(income.json carries no annual revenue line); the disqualifier check was rebuilt from the filed income statements, yielding two consecutive decline years (2021, 2022), not the feature's stated zero.fit_features.balance_sheet_classisnot_computable(FY2025 debt/cash absent from the feed); net-debt class was computed from the FY2025 10-K balance sheet — total debt $136.1B less cash $18.2B = ~$117.9B net, ~2.6x reported / 2.53x on management-adjusted EBITDA, i.e. moderate.fit_features.fcf_stabilityis empty (fewer than five consecutive adjusted-FCF years), so P2 rests on management-reported FCF.- AT&T discloses no non-GAAP Free Cash Flow or consolidated Adjusted EBITDA line in its 10-Ks; reported FCF is taken from earnings releases/transcripts and adjusted EBITDA is implied from management's stated 2.53x leverage.
- Consensus positioning (X4) relied on a single web-search snapshot because the Parallel web-research pipeline failed on insufficient credit; the corpus-based multiples (7.6x P/E, 1.3x P/sales) are the primary, filing-anchored evidence.
- The CapIQ consensus-revision series spans only the trailing 180 days (from 2026-01-24, after the September 2025 peak), so estimate movement across the earliest leg of the drawdown is not directly captured.
- FINRA returned no reported short-interest rows for T in this run, so the short side of the seller composition cannot be quantified.
- Instrument facts (I1) rest on dated third-party web sources, not a filed primary document; the options-liquidity figure is a single-session snapshot and implied volatility can move quickly around the EchoStar close.
- No open-market insider purchase data to assess conviction — all recent Form 4 activity is equity grants/awards (code A).
Business — AT&T Inc. (NYSE: T)
AT&T is the third of the three US national wireless carriers and one of the country's largest fiber-broadband builders: FY2025 revenue of $125.6B, operating income of $24.2B, and 120 million mobility subscribers, run over an FCC-licensed spectrum-and-fiber network [1] [2]. It clears both universe tests — a US-listed common stock at roughly $165B of market value — and it is neither an auto maker nor a high-multiple market darling. China dependence is effectively absent.
The universe screen
Ruchir's system only looks at US-listed stocks (or European companies with a US-listed ADR) above $10B of market cap. AT&T passes both, plainly.
Market Cap ($B)
Share Price (23 Jul 2026)
Trailing P/E
Sources: market cap from fit_features.market_cap_usd (7.179B shares at the $22.96 close of 23 Jul 2026); EPS of $3.04 from the FY2025 10-K Consolidated Statements of Operations [3].
- Geography and instrument (U1): AT&T Inc. is a Delaware-incorporated holding company whose common stock trades on the New York Stock Exchange under the ticker T; it is a domestic US issuer, not a Chinese company and not an ADR [4]. The screen is clean.
- Market cap (U2): at the 23 July 2026 close of $22.96 on 7.179 billion shares outstanding, market value is about $164.8B — more than sixteen times the $10B line [5]. Third-party market data over 22–24 July 2026 put the figure in a $150–165B range; either way the test is passed comfortably.
Market cap is fit_features.market_cap_usd; share count from the FY2025 10-K, price from the daily feed dated 23 Jul 2026. Listing venue cross-checked against current market data (NYSE: T), July 2026.
What the company is, and how it makes money
AT&T sells connectivity. It carries voice and data over a nationwide wireless network and delivers internet over a fiber and copper wireline network, charging consumers and businesses recurring monthly service fees plus one-off equipment (handset) sales. Two sentences for a cold reader: AT&T is a US telecommunications carrier that earns most of its money selling wireless phone service to 120 million subscribers and fiber broadband to households and businesses. It is one of three national mobile networks in a capital-heavy, FCC-licensed industry, and its revenue is almost entirely earned in the United States, with a small wireless operation in Mexico.
The company reports two segments — Communications and Latin America. Communications supplied about 97% of 2025 segment operating revenues and substantially all segment operating income; Latin America (wireless service in Mexico) was roughly 3% of revenue and under 1% of operating income [6] [7]. Communications breaks into three business units:
- Mobility — nationwide wireless service and handsets; the profit engine.
- Business Wireline — fiber, ethernet, IP voice and managed services to businesses, alongside a shrinking book of legacy copper-based voice and data.
- Consumer Wireline — residential broadband (fiber and the AT&T Internet Air fixed-wireless product) plus legacy home phone.
Source: FY2025 10-K, MD&A Segment Results — Mobility, Business Wireline and Consumer Wireline detail [8]. Communications (Mobility + Business Wireline + Consumer Wireline) totals $120.9B; consolidated revenue of $125.6B includes Latin America and Corporate & Other eliminations.
Mobility dominates: it earned $89.5B of revenue in 2025, up 5.0%, on 120 million subscribers — 91 million postpaid (74 million postpaid phone), 18 million prepaid and 11 million reseller — with postpaid ARPU still rising and monthly postpaid-phone churn in the low single digits, per the segment operating metrics [9] [10]. Consumer broadband is the growth story management is investing behind: 10.4 million fiber connections (up 1.1 million in the year) inside 16.0 million total broadband connections [11]. The two segments split the map cleanly: the United States for Communications, Mexico for Latin America (about 24.7 million subscribers under the AT&T and Unefon brands) [12].
Scale
FY2025 Revenue ($B)
Operating Income ($B)
Net Income to AT&T ($B)
Employees
Source: FY2025 10-K — revenue, operating income and net income from the Consolidated Statements of Operations [13]; headcount of approximately 133,030 from the Human Capital disclosure [14].
Total operating revenue was $125.6B in 2025, up 2.7%, after two essentially flat years — $122.4B in 2023 and $122.3B in 2024 [15]. Earlier years are not comparable: AT&T spun off WarnerMedia in April 2022 and separated its DIRECTV video business over 2021–2025, so pre-2023 consolidated revenue included businesses the company no longer owns [16]. On the continuing base, revenue is flat-to-rising, not declining — the three-consecutive-years-of-decline disqualifier that the Durability tab tests is not triggered at the consolidated level.
Roughly 43% of employees are represented by the CWA, IBEW or other unions, with several contracts expiring in 2026 — a recurring source of operational and cost risk [17].
Market structure — the raw material for durability
US wireless is a facilities-based oligopoly. Three carriers own national networks — AT&T, Verizon and T-Mobile — supplemented by regional providers, resellers (MVNOs) and cable companies reselling wireless over those same three networks [18]. The three carriers are close in scale, which is what an oligopoly looks like from the outside: AT&T at $125.6B of revenue sits between Verizon ($138.2B) and T-Mobile ($88.3B).
Sources: AT&T FY2025 10-K [19]; peer revenue and market cap from each company's latest reported financials and current market data (as reported).
Four structural features make year-10 revenue and cash flow more forecastable than in most industries — the evidence the Durability tab and the jury build on:
- Regulatory entry barriers. A wireless carrier must be licensed by the FCC to transmit on specific spectrum bands in defined geographies; licenses run a fixed 10–15 years and must be renewed, and the FCC controls how much spectrum exists to license at all [20]. A new entrant cannot simply appear; it must win scarce, auctioned spectrum. This is the "regulator does not let a garage startup take share" barrier in Ruchir's framework.
- Capital intensity as a moat. The balance sheet carries $131.6B of property, plant and equipment and $128.1B of FCC licenses, and the company spends on the order of $20B a year on capital [21]. Replicating a national network is a multi-decade, multi-hundred-billion-dollar undertaking.
- Essential product. Mobile and broadband connectivity is close to a utility; low single-digit monthly postpaid-phone churn reflects how sticky the service is once sold [22].
- Long operating history. The legal entity traces to the 1984 Bell System breakup, when it was spun off from AT&T Corp as Southwestern Bell / SBC, later renaming itself AT&T after the 2005 merger — more than four decades as an independent public carrier, on top of the century-old Bell franchise it descends from [23].
Two qualifiers keep this honest. First, broadband is a different structure from wireless: in fixed internet AT&T competes market-by-market mainly against large cable operators (Comcast, Charter) and against the other carriers' fixed-wireless offerings — closer to regional duopolies than a tidy national oligopoly [24]. Second, part of the business is in genuine secular decline: legacy copper voice and data is shrinking every year, and Business Wireline revenue fell 8.4% in 2025 to $17.2B with the segment now running an operating loss [25]. The durable core is wireless plus fiber; the legacy tail is a managed run-off. Whether the growing core outruns the shrinking tail is the question the Durability tab carries.
Leverage is worth flagging here because it colours how essential the balance sheet makes the business: total debt was $136.1B against $18.2B of cash at year-end 2025, so net debt is about $117.9B, roughly 2.6 times an EBITDA of about $45.0B (operating income of $24.2B plus $20.9B of depreciation and amortization) [26]. That is a moderately levered balance sheet, not a fortress and not distressed; the Yield and Self-Help tabs carry what the leverage does to the yield bar and to refinancing.
First-pass exclusion screen
None of the three exclusions this tab can settle is triggered. AT&T is not an auto maker; it trades like a value/income stock, not a market darling; and it has no material China exposure.
Auto-OEM (X1) — not applicable. AT&T manufactures nothing automotive; it is a telecommunications carrier whose only hardware sales are handsets it resells to its own subscribers [27]. The car-company value-trap screen does not apply.
Darling positioning (X4) — clears. The exclusion targets high-growth names on extreme multiple-to-sales where consensus already owns the story. AT&T is the opposite. At $22.96 it trades at about 7.6 times trailing EPS of $3.04 and roughly 1.3 times sales ($164.8B market cap on $125.6B revenue) — mid-pack among its peers (Verizon ~1.3x, T-Mobile ~2.1x, the cable operators lower) and nowhere near darling territory [28]. The sell side is constructive but not euphoric: 26 analysts carried a consensus "Buy" with an average target near $28.90 in late July 2026. This is a low-multiple, dividend-oriented telecom, not a bottom-left-to-top-right growth story.
Multiples derived from the FY2025 10-K and the 23 Jul 2026 price; peer multiples from current market data and each peer's latest revenue. Consensus rating and target from third-party analyst aggregation, July 2026 (as reported).
China dependence (S1) — effectively absent. AT&T's revenue is earned in the United States and Mexico; the Latin America segment (Mexico only) is about 3% of segment revenue, and no single customer accounts for 10% or more of consolidated revenue [29] [30]. The filings disclose no material China revenue or China-based assets; the only China linkage is ordinary supply-chain exposure to network and device vendors, which the 10-K does not quantify as a dependence. The sensitivity flag is not raised.
There is a real dislocation: AT&T fell −30.9% from a September 2025 peak of $29.62 to a July 1, 2026 trough of $20.48, and trades at $22.96. But its anatomy is a multiple de-rating, not an earnings break — over the same window forward EPS estimates rose and the company beat consensus EPS every quarter. Selling volume peaked at only 2.37× the pre-fall median. The operative trigger was narrative and mechanical — a satellite-competition scare, an analyst downgrade, and index-exclusion flow — not a guidance cut.
The drawdown — one number, two legs, a full round-trip in between
The fall spans 289 days and −30.9%, but it is not one move. The stock dropped, recovered almost the entire loss, then fell further and deeper.
Source: derived from the daily price feed; peak $29.62 (2025-09-15), trough $20.48 (2026-07-01), current $22.96 (2026-07-23) per fit_features.capitulation_gauge.drawdown. Company filings, as reported.
The shape is a W, confirmed by the moving-average signals: a death cross on 2025-11-07, a golden cross on 2026-03-25, then a second death cross on 2026-05-27.
Source: derived from the daily price feed; interim rebound high $29.10 on 2026-03-27. Company filings, as reported.
The fit_features peak-to-trough of −30.9% is arithmetically correct, but it straddles a recovery that carried the stock back to within $0.52 of the September peak by late March. The operative dislocation is the second leg — −29.6% from $29.10 (Mar 27) to $20.48 (Jul 1) — and that is where the anatomy below concentrates.
The trigger — two different stories
Leg 1 was a demanding valuation meeting a merely-fine quarter, not a fundamentals break. AT&T reported Q3 FY2025 on October 22, 2025: 405K postpaid phone net adds to 73.8M subscribers, +2.3% mobility service revenue [1], $4.9B of free cash flow [2], and full-year guidance affirmed — capital investment of $22B to $22.5B and adjusted EPS at the higher end of $1.97 to $2.07 [3]. Consensus was met, not beaten: EPS surprise +0.4%, revenue −0.6%. For a stock sitting near a 52-week high, an in-line print was not enough — shares fell −3.64% on October 23 on 107M shares, roughly triple normal turnover. The larger single-day drop of the leg, −4.40% on October 6, preceded earnings and had no company-specific catalyst in the corpus; it reads as a macro/rate move, not an event.
Leg 2 had no earnings deterioration at all. Between the March high and the July trough, AT&T reported Q1 FY2026 (Apr 22): adjusted EPS growth of +11.8% year over year, ahead of consensus [4]. Nothing in the filed record explains a −30% leg. The identifiable, dated drivers are external to the numbers and come from the market, not the company:
- A competitive-narrative scare. Through June 2026, sell-side and press coverage repriced AT&T's long-term broadband and wireless growth for the low-earth-orbit satellite threat (Starlink), questioning what the growth story is worth if satellite operators sell direct-to-device plans.
- An analyst downgrade. Oppenheimer downgraded the stock in June 2026, flagging both the satellite threat and execution risk on AT&T's fiber build — the view that penetration could disappoint and the company might stop nearer 50M locations than its 60M-by-2030 ambition, a large capex bet whose payoff the market began to doubt.
- Mechanical index selling. AT&T's removal from a Russell top-tier index at the late-June reconstitution forced passive/institutional selling into the exact window of the trough.
- A management-continuity overhang. CFO Pascal Desroches's planned departure (successor Jennifer Biry named July 6) landed days after the July 1 bottom, adding transition risk rather than causing the low.
(The four bullets above rest on press and sell-side reports — tikr.com, stockstotrade.com, ts2.tech — not the filed corpus, and are attributed as such.)
Then the fear reversed on a number. AT&T reported Q2 FY2026 on July 22, 2026 with adjusted EPS up +20.4% year over year, +2.7% service revenue and $4.7B free cash flow [5]; the stock recovered +12% off the trough into the current $22.96.
The fear gauge — orderly repricing more than panic
The measured volume spike is 2.37× — the peak 20-day average daily volume during the fall against the median daily volume over the 180 days before the peak (roughly 33M shares).
Volume spike: 2.37× trailing median (fit_features.capitulation_gauge.volume_spike). AT&T's historic panic days ran 4–5× (Apr 2018 5.1×, May 2021 5.4×, Apr 2023 4.3×). This drawdown never reached those multiples.
Source: fit_features.capitulation_gauge; historic spike multiples from the daily volume feed. Company filings, as reported.
Where the volume concentrated matters: it clustered at the end of the fall, not the trigger. Monthly average turnover was ~30M shares before the peak, rose to ~63M in October (leg 1), and spiked to ~60M in June and ~85M in July as the second leg capitulated. The single heaviest day was June 30, 2026: −5.13% on 126.6M shares — the day before the July 1 trough. That late clustering is consistent with forced and emotion-driven selling into the low (the index-reconstitution flow fits here). But a 2.37× peak multiple is a modest reading: this looks more like a sustained, orderly de-rating than a violent, single-day capitulation.
Who was selling — diffuse, with one mechanical hand
The seller evidence is thin and, where it exists, points away from informed distribution.
- Short interest: not available. FINRA returned no reported short-interest rows for the ticker in this run, and no days-to-cover or borrow-pressure data was staged. The short-side of the story cannot be quantified here — a genuine data gap, not a finding of low short interest.
- Insiders neither sold nor bought. Across the drawdown window (2025-09-15 to 2026-07-24) the only insider Form 4 activity was 14 routine grants/awards (code A) — zero open-market sales and zero open-market purchases. No insider distributed into the fall; equally, no insider stepped in to buy the −31% dip.
- The 5% holders are passive. The disclosed >5% owners are index managers (BlackRock, Vanguard). Their positions track index weight, which is the point: the one identifiable forced seller is mechanical — the late-June index-reconstitution flow described above — rather than an investor acting on a changed view of the business.
Net: a broad, sentiment-driven de-rating by an income/institutional holder base, with index-exclusion flow the only nameable structural seller. No evidence of informed insiders selling ahead of the fall.
Estimates vs price — the framework's signature, in its cleanest form
The framework looks for a price fall that outruns the estimate cut. Here there was no estimate cut at all: forward estimates rose while the price fell.
Source: CapIQ consensus revision series, data/sp/estimates.json (momentum snapshots); price from the daily feed. Company filings, as reported.
Over the 180 days the momentum series covers, consensus FY2027 EPS rose from $2.45 to $2.57 (+4.6%) and FY2028 EPS from $2.58 to $2.91 (+12.8%); FY2027 revenue estimates climbed ~2%. Across the same span the stock round-tripped from $23.59 up to $29.10 and down to $20.48, ending lower. Because the earliest estimate snapshot (January 2026) already sits below today's, the full −30.9% peak-to-trough came with zero downward revision to forward earnings.
The realized numbers say the same thing. AT&T beat consensus EPS in every quarter of the drawdown, and the beats widened:
Source: CapIQ actual-vs-consensus, data/sp/estimates.json (beat_miss). Company filings, as reported.
Reported adjusted EPS growth accelerated through the fall — +11.8% in Q1 FY2026 to +20.4% in Q2 FY2026 [6] [7]. Revenue surprises stayed inside ±2% throughout. On every measurable axis, the earnings line went one way and the price went the other.
Bottom line
A real dislocation exists — a −30.9% drawdown to a July 1 trough, now $22.96 — and it carries the framework's signature almost to caricature: the stock fell ~31% while forward estimates rose 5–13% and the company beat EPS every quarter. The repricing was driven by a competitive narrative (satellite), an analyst downgrade, and mechanical index-exclusion selling, not by any deterioration in the filed numbers. Two cautions keep it honest: the drawdown is a slow, two-legged de-rating spanning a full recovery, not a single-event crash, and its peak selling multiple of 2.37× is well short of AT&T's own historic panic days — orderly repricing more than capitulation. What happened to the price is clear; what it means for value is not this tab's to judge — see Damage Math and Fit.
AT&T's price erased about $48B of equity value from the September 2025 peak to today, and roughly $66B to the July 2026 trough — yet not one near-term consensus number fell. Forward EPS estimates rose 5–13% and full-year guidance was reaffirmed mid-drawdown. The one filed permanent driver, the Business Wireline copper runoff, capitalizes to at most ~$25–36B in isolation and to near zero at the consolidated level. Whether the residual gap is mispricing is the trial's call: the probability the impairment is temporary is 0.64, contested.
The near-term hit: an empty numerator
The framework's canonical setup is a short-term earnings cut that the price anchors to — Centene cut EPS by two-thirds and the stock fell two-thirds. AT&T is the opposite case: over the visible revision window there was no cut to anchor to. Forward EPS estimates rose, and management reaffirmed its full-year and multi-year guidance during the sell-off.
Source: consensus estimates (as compiled 2026-07-23); the revision series reaches back 180 days, to 2026-01-24 — after the September peak, a window limit flagged in the Dislocation drawdown anatomy.
Guidance did not move down either. At the Q2 2026 print — reported July 22, mid-drawdown — AT&T maintained free cash flow of "$18 billion+ in 2026, $19 billion+ in 2027, and $21 billion+ in 2028," adjusted EPS of $2.25–$2.35 in 2026 with a double-digit three-year CAGR, and capital investment held at $23–24B a year [1]. Consensus free cash flow rises from $18.2B (2026E) to $22.6B (2029E). Every quarter through the drawdown beat consensus EPS. The numerator of a damage-math calculation — the near-term cash the problem removed — is, on the reported and guided record, approximately zero.
The near-term earnings hit is not merely small; it is absent. No FY1/FY2 consensus figure fell around the trigger, and guidance was reaffirmed. What repriced was the terminal value the market assigns to those cash flows, not the cash flows themselves.
The price and enterprise-value change over the same window
Against a flat-to-rising earnings path, the equity fell hard. Holding the share count constant at 7.179B (it has drifted down ~0.7%/yr, not up), the market capitalization moved from about $212.6B at the $29.62 peak to $147.0B at the $20.48 trough and $164.8B at today's $22.96.
Sources: market cap derived from fit_features prices (peak/trough/current) at a constant 7.179B shares; net debt of $126.4B at June 30, 2026 (total debt $144.0B less cash) [2], and $117.5B at year-end 2025 for the peak column.
Market cap now ($B)
EV now ($B)
The equity holder bore the full move — about $47.8B (−22.5%) peak-to-current and $65.6B (−30.9%) peak-to-trough. Enterprise value fell less, roughly $38.9B (−11.8%), because net debt rose about $9B over the window — the February 2026 Lumen fiber purchase ($5.75B cash) and elevated capital investment, not operating losses. A further step is pending: the all-cash EchoStar spectrum purchase (~$23B) is expected to lift net debt-to-adjusted EBITDA "to the 3x range" before returning "to the 2.5x range within approximately 3 years" [3]. That leverage path is examined in Self-Help.
The NPV arithmetic, conservatively
The profile's adjusted-FCF yield is not_computable — SBC and a complete five-year acquisition window are missing in the deterministic feature file (fit_features.adjusted_fcf), so this tab anchors on AT&T-defined free cash flow (operating cash flow less capital investment), the number management guides to and consensus forecasts. The full yield treatment sits in Yield.
A transparent way to read the damage is to ask what perpetual free-cash-flow growth each price level implies. Treating equity FCF as a growing perpetuity, value = FCF ÷ (r − g). Using the reaffirmed 2026 guidance floor of $18.0B and a telecom cost of equity of r = 8.5%, the implied growth rate falls straight out of the price.
Source: derived — implied g = r − FCF ÷ price, on $18.0B equity FCF and market caps of $212.6B / $147.0B / $164.8B.
Source: derived — implied perpetual FCF growth rate at three discount-rate assumptions.
Across a reasonable discount range, the peak price implied roughly flat perpetual FCF; the current price implies a permanent decline of about 2%–3% a year; the trough implied nearly 4%. Guidance and consensus point the other way — FCF rising 5%–7% a year near-term ($18B → $19B → $21B through 2028). The two scenarios frame the gap:
If temporary — a sentiment and multiple de-rating, earning power intact — intrinsic value did not change. Because no consensus estimate fell and guidance rose, the entire equity decline is the mispricing: about $47.8B peak-to-current, $65.6B peak-to-trough.
If permanent — a level shift down in sustainable cash flow — the price is capitalizing a specific loss. To justify the $47.8B equity decline on a flat $18B perpetuity at 8.5% requires a permanent FCF reduction of 0.085 × 47.8 ≈ $4.1B a year — sustainable FCF stepping down to roughly $13.9B, about 23% below the guide, forever. The trough would require ~$5.6B a year, a ~$12.4B run-rate.
The question is whether the filed evidence supports a permanent $4B+ annual cash-flow loss. It points instead to a bounded, self-terminating drag, quantified next.
Which line broke, and whether it self-corrects
The identifiable permanent driver is the legacy wireline runoff, concentrated in the Business Wireline segment. Management's own discounted-cash-flow work already marked it down twice: a $24.812B non-cash goodwill impairment across Business Wireline, Consumer Wireline and Mexico in 2022 [4], then a further $4.422B in 2024 writing off "the entirety of Business Wireline reporting unit goodwill," on plans reflecting "lower long-term projected future cash flows associated with the industry-wide secular decline" [5]. These are DCF resets, not timing effects — the permanent case's strongest exhibit.
Source: FY2025 Annual Report (Form 10-K), Segment Operating Income (Loss) [6].
Business Wireline operating income fell from $1.289B in 2023 to a $0.816B loss in 2025 [7], extending a four-year margin slide from 10.2% in 2022 and 6.2% in 2023 [8] to negative 4.7% in 2025 [9]. The runoff accelerated after the market reset: within the segment, Legacy revenue fell 25.9% year over year in Q2 2026 and Legacy operating income fell 45.5%, as AT&T works "to power down and stop providing service over the large majority of its domestic copper-based network by the end of 2029" [10].
Source: Q2 FY2026 Earnings Release (Form 8-K, Ex-99.1), Legacy segment [11].
Two features determine whether this self-corrects. First, it is finite and self-terminating: the segment already earns a negative margin, so the remaining EBIT-to-a-floor drag is bounded, and management has set an explicit terminal date — copper powered down by end-2029. Second, it lands on a consolidated base that keeps growing. Mobility operating income rose 3.4% to $27.196B in 2025, and total segment operating income rose 3.1% to $27.927B despite Business Wireline [12] — the wireless engine and Consumer Wireline more than absorbed the runoff at the group level.
That sets the permanent-side bound. Capitalizing the Business Wireline operating-income swing in isolation as a lost perpetuity — treating the 2023-to-2025 fall of ~$2.1B, or the ~$3.1B slide from the 2022 peak, as gone forever at 8.5% — values the damage at roughly $25–36B. At the consolidated level, where total segment income and free cash flow both rose, the realized permanent cash-flow loss is far smaller, near zero on the reported tape. Either way, the number is below the ~$48B peak-to-current and ~$66B peak-to-trough the price removed. The permanent case's more durable argument is not the reported runoff but the terminal-value-plus-reinvestment claim: that $23–24B of annual capital and the EchoStar/Lumen build consume cash before they accrete, permanently capping per-share NPV even as headline FCF holds — a claim the current tape cannot yet refute.
Damage gap, as arithmetic: the price destroyed roughly $48B of equity value peak-to-current (up to $66B peak-to-trough), against an identifiable filed permanent driver worth at most ~$25–36B capitalized in isolation and near zero consolidated. Under conservative assumptions a residual of roughly $12–48B is not matched by identifiable permanent cash-flow loss. Whether that residual is mispricing or an unbooked terminal-value reset is the trial's question, below — not this tab's to decide.
The trial: temporary versus permanent
The temporary-or-permanent question was argued by two opposing, corpus-cited briefs and ruled on by three blind judges. Both cases are strong.
The case for temporary. The price fell for reasons unattached to cash flow — a speculative Starlink mobile threat, an analyst downgrade, a CFO retirement, and mechanical index-exclusion selling — while the operating engine accelerated. In Q2 2026 adjusted EBITDA rose 5.2% (margin up 110bps to 39.1%), adjusted EPS rose over 20%, wireless service revenue grew 3.3% on 432,000 postpaid phone net adds with ARPU up and churn down, and management reaffirmed full-year guidance and $18B+ FCF [13]. Cash flows rose while the price fell; consensus forward FCF climbs to $22.6B by 2029, and the mean analyst target of $28.70 sits ~25% above the price. In this reading the ~$48B decline is a de-rating that mean-reverts as guidance and pricing power hold.
The case for permanent. Management's own impairment DCFs already marked terminal wireline cash flows permanently lower — $24.812B in 2022 and the entire $4.422B of Business Wireline goodwill in 2024, on "lower long-term projected future cash flows" [14]. Business Wireline is a structural runoff — revenue falling toward a copper power-down, margin already negative, the decline accelerating to −25.9% in Q2 2026 [15]. Wireless is not an unlimited offset — 2025 ARPU actions were "largely offset by increased promotional activity" [16] — and the replacement engine needs $23–24B of annual capital plus EchoStar leverage to the 3x range before it pays off [17]. A recovery in reported EPS would not restore the NPV of retired copper.
Ruling: p(temporary)
Source: adversarial diagnosis trial, per-judge ruling and reading-order controls (ruchir/trial/tally.json).
The panel put the probability the impairment is temporary at 0.64, a contested ruling: the individual judges landed at 0.64, 0.43 and 0.68, a spread of 0.25. Reading order left a footprint — the judge who read the temporary brief first sat at 0.64 versus a 0.555 mean for the two who read the permanent brief first, an 0.085 gap — so the contest is not fully order-independent. One permanent-side page pointer (a wireline-impairment phrase cited to FY2024 p56) did not verify there; the substance holds on p102, which both sides cite. The report carries the panel's number, not this tab's: temporary is the more likely reading at 0.64, but a permanent terminal-value reset commands meaningful weight, and the tape through 2027–2028 — legacy stabilization, FCF reaching the $21B guide, leverage returning toward 2.5x after EchoStar — is what would settle it.
Yield
AT&T's reported free cash flow of $16.6 billion on today's $164.8 billion market cap is a 10.1% yield — level with the framework's 10% bar [1]. The framework's adjustment cuts that roughly in half. Subtracting stock compensation and the five-year average of acquisition spend — almost all of it spectrum — leaves adjusted FCF near $8.2 billion, a 5.0% yield, about 500 basis points short. The whole gap is the 2021–22 C-band spectrum bulge, now rolled off.
Figures are as-reported in U.S. dollars. "Reported FCF" is AT&T's own free-cash-flow measure — cash from operations, plus DirecTV distributions where applicable, less capital expenditures and cash paid for vendor financing [2]. From 2025 management reports it excluding DirecTV; where the DirecTV seam moves a number, the text says so. All yields are struck on the current $164.8 billion market cap (7.179 billion shares at $22.96 on July 23, 2026), from fit_features.market_cap.
The deterministic feature file could not build any of this tab's core quantities: fit_features.adjusted_fcf.latest_adjusted, adjusted_fcf_yield, yield_baseline and balance_sheet_class all return not_computable — stock compensation is absent for the early years, no clean five-year adjustment window survives in the structured feed, and the FY2025 debt line is missing. Every figure below is rebuilt from the filed cash-flow statements, the share-based-compensation note and management's reported free cash flow, each anchored to its page.
The adjustment, line by line
Adjusted FCF removes two things the reported number keeps: the cost of paying employees in stock, and the capital that leaves the business as acquisitions — for AT&T, overwhelmingly spectrum. The three most recent years are the ones with a complete trailing five-year acquisition window inside the corpus.
Adjusted FCF = reported FCF − stock compensation − trailing five-year average acquisitions; yield on the current $164.8B market cap. Reported FCF: 2025 $16.6B [3], 2024 $17.6B [4], 2023 $16.8B [5]. Stock comp per FY2025 10-K Note 15 [6]. Acquisition averages derived from the cash-flow statements [7][8][9].
Two lines carry the weight. Stock compensation is trivial. AT&T recognized $536 million of share-based compensation in 2025, $505 million in 2024 and $479 million in 2023 — under half a percent of revenue and about 3% of reported FCF [10]. For a company this size that is a rounding item; the adjustment barely registers. This is the opposite of the software names the SBC screen is built to catch.
Acquisitions do all the work — and they are spectrum. The trailing five-year average of "Acquisitions, net of cash acquired" runs $7.9–8.4 billion across these three years, and the FY2022 10-K breaks that line into its parts: it is almost entirely spectrum, not businesses [11]. Two years dominate the window. In 2021 AT&T paid $24.7 billion for C-band licenses won in FCC Auction 107; in 2022 it paid a further $9.1 billion, largely for 3.45 GHz spectrum [12]. Every other year in the series is far smaller.
The 2021 C-band ($24.7B) and 2022 3.45 GHz ($9.1B) auctions are ~90% of the seven-year total; 2024–25 ran under $0.4B. Continuing-operations basis. 2019–2021 per the FY2021 10-K [13]; 2020–2022 breakdown per the FY2022 10-K [14]; 2023–2025 per the FY2025 10-K [15].
So the adjustment is not really a stock-comp haircut; it is a spectrum haircut, and it is large because the five-year window still contains a once-a-decade mid-band build-out. That is the fact the reader has to weigh: whether $7.9 billion a year is the right run-rate to charge against owner earnings, or a backward-looking artifact. The Normalized spectrum charge section works both readings.
The yield, three ways
Reported FCF yield (FY25)
Adjusted FCF yield (FY25)
3-yr avg adjusted yield
Reported: $16.6B ÷ $164.8B. Adjusted current: $8.19B ÷ $164.8B. Three-year average adjusted FCF ($8.36B, FY2023–25) ÷ current cap. Sources as in the adjustment table above [16][17][18].
On reported FCF, AT&T yields 10.1% today and has sat around that level for a while; on adjusted FCF it yields 5.0%, and the three-year average adjusted yield is essentially the same at 5.1%. The adjusted figure is stable, not volatile — the spectrum charge is steady enough that the current year and the three-year average land within ten basis points of each other.
On the baseline and the "jump" test, AT&T is not the fortress signature. The framework's prized pattern is a name that yielded a stable ~3.5–4% for years and suddenly prints 8–9% — a dislocation, not a re-rating. AT&T is the reverse: its reported FCF yield has been persistently elevated for years — a high-single-digit-to-low-double-digit level that reflects durable market skepticism about $117.9 billion of net debt and cable's encroachment, not a sudden break from a calm baseline. The fit_features.yield_baseline feature is not_computable (it needs fiscal-year-end prices and same-year shares the feed lacks), so there is no clean per-year distribution to point to; that read is qualitative, drawn from the steadiness of the reported-FCF band against a market cap that has traded at a discount throughout. What has moved recently is price: the drawdown from $29.62 in September 2025 to a $20.48 trough — 31% peak-to-trough, with the stock at $22.96 now — lifted the reported yield roughly 230 basis points (from ~7.8% at the September peak market cap to 10.1% today) and the adjusted yield about 110 basis points (from ~3.9% to 5.0%). That is a cyclical lift on top of a persistently elevated level — the anatomy of it sits in Dislocation — not a fortress jumping off a stable base.
Which bar applies
The reference line comes from the balance sheet. The balance_sheet_class feature is not_computable (the FY2025 debt line was missing from the feed), so it is rebuilt here.
Net debt ($M)
Adj. EBITDA ($M, implied)
Net debt / adj. EBITDA (×)
Reference bar
Net debt = total debt $136,100M (long-term $127,089M + current maturities $9,011M) − cash $18,234M, per FY2025 10-K balance sheet [19]. Adjusted EBITDA implied from management's stated 2.53× leverage; ratio per the Q4 FY2025 call [20].
Net debt is $117.9 billion [21]. AT&T states it ended 2025 at net debt to adjusted EBITDA of 2.53 times, at its 2.5× target [22]; that ratio implies adjusted EBITDA near $46.6 billion. Against the framework's rule — fortress at net debt/EBITDA ≤ 0.5×, levered at ≥ 3.0×, moderate in between — 2.53× is moderate, which selects the 10% default bar, not the ~8–9% fortress line and not the 25% levered line.
That places the read plainly: 5.0% adjusted yield against the 10% bar is 500 basis points short — the name yields about half its bar on the mechanical adjustment. Even the unadjusted 10.1% only reaches the bar because it ignores the spectrum spend the balance sheet had to fund. One caveat on the bar itself: the pending EchoStar and Lumen deals push pro-forma leverage to roughly 3.2× on close, before management guides it back toward 3.0× by year-end 2026 and to the 2.5× target within about three years [23]. At 3.2× the name would momentarily tip into the levered class — but that is a deliberate, temporary step-up for spectrum, not structural leverage, so the 10% bar is the honest reference line, with a note that leverage is heading the wrong way near-term.
Normalized spectrum charge
AT&T is not a cyclical business — its cash does not swing with a commodity or an underwriting cycle — so there is no mid-cycle earnings normalization to do on the revenue line. The normalization that matters is the acquisition line, because the mechanical five-year average is dominated by a spectrum event that does not repeat annually. This is the judgment on top of the arithmetic, stated so it can be recomputed under different assumptions.
The mechanical charge is ~$7.9 billion a year. Its components: the 2021 C-band ($24.7B) and 2022 3.45 GHz ($9.1B) auctions supply roughly 90% of it, while the ordinary years — 2019, 2020 and 2023 — ran $1.6–2.9 billion and 2024–25 ran under $0.4 billion [24][25]. A defensible mid-cycle charge treats the C-band super-cycle as non-repeating, but does not zero out spectrum — because it does recur. In August 2025 AT&T agreed to buy 600 MHz and 3.45 GHz licenses from EchoStar for approximately $23 billion, closing in early 2026 [26]. Amortized over a ~10-year license life that is ~$2.3 billion a year; add ordinary auction and small-M&A cadence of ~$1.5–2 billion, and a mid-cycle charge lands near $4 billion a year.
All on FY2025 reported FCF $16.6B less $0.54B stock comp less the stated spectrum charge, over the current $164.8B cap. Sources as above.
The point of showing all three: under every acquisition assumption from mechanical to generous, the current adjusted yield sits below the 10% bar — 500 basis points short on the mechanical charge, 270 short at a mid-cycle $4 billion, and still ~90 short even if you treat the pending $23 billion EchoStar purchase as a one-off and charge only $1 billion a year. The reported 10.1% clears the bar only by pretending spectrum is free. It is not: the balance sheet funded $34 billion of it in two years and is about to fund $23 billion more.
The consensus check and the forward path
The current-year read is below the bar on adjusted FCF. The forward question is whether it reverts above it, and here consensus is genuinely constructive — but on the reported line, which is the distinction the adjustment exists to draw.
Consensus reported-FCF yields from S&P Capital IQ estimates (fit_features.consensus_forward_yield, source data/sp/estimates.json): FCF means of $18.2B (2026), $19.25B (2027), $21.2B (2028), $22.6B (2029) over the current $164.8B cap. Adjusted-forward applies −$0.55B stock comp and a −$4B mid-cycle spectrum charge to each. Management's own guidance aligns: FCF over $18B in 2026, growing ~$1B in 2027 and ~$2B in 2028 [27].
Consensus reported-FCF yield already clears the bar — 11.0% in 2026 rising to 13.7% by 2029 — and the sell side and management agree on the path: FCF grows from $16.6 billion toward roughly $22 billion as the fiber build peaks, capital intensity eases from high-teens to mid-teens percent of revenue, depreciation holds near $20 billion, and $4 billion of cost savings land by 2028 [28][29]. Management underwrites the same math from the return side: over $45 billion of planned 2026–28 shareholder returns is described as "over 75% of our expected free cash flow," which implies roughly $60 billion of three-year FCF, about $20 billion a year [30].
The adjusted line tells the harder story. Charge the same mid-cycle $4 billion spectrum and $0.55 billion stock comp against consensus FCF, and the adjusted forward yield runs 8.3% in 2026, 8.9% in 2027, and crosses the 10% bar around 2028 at 10.1%, reaching 10.9% by 2029. So the mean-reversion underwrite is not "already agreed" — it is a two-to-three-year path, and it has to clear two conditions to land:
- FCF growth of ~$6 billion (36%) by 2028–29 must materialize. It is well-supported — capex intensity is falling as major projects complete by 2030, D&A is flat, and consensus and management guidance coincide — but it is not yet in the numbers.
- Spectrum and M&A must not re-accelerate beyond EchoStar. A fresh auction super-cycle on the scale of C-band would reset the trailing charge upward and push the crossing out again. The recurring nature of spectrum — the very reason the adjustment charges for it — is also the main threat to the reversion.
My read, stated once: on adjusted FCF, AT&T sits below the 10% bar today under every reasonable spectrum assumption, and reverts above it around 2028 only if consensus FCF growth is roughly right and spectrum spend normalizes toward $4 billion a year. I would put that reversion at a little better than even — call it 55–60% within three years — because the FCF path is corroborated by both management and the sell side, while the spectrum-normalization leg is the genuine uncertainty. The strongest fact against the read is that on reported FCF the name already yields 10% and consensus has it rising to 13%+ — a skeptic can fairly argue the spectrum charge double-counts capital the market already sees in the leverage. The strongest fact for it is that AT&T is, on the record, about to spend $23 billion more on spectrum, so treating that spend as real is not conservatism — it is arithmetic. What would move the read: capital intensity easing on schedule and a quiet spectrum calendar would pull the crossing into 2027; another C-band-scale auction would push it past 2029.
Conversion is holding
A deteriorating FCF-to-revenue trend would undercut both the reversion and the durability case. It is not deteriorating.
Reported FCF over total operating revenues (continuing operations): 2022 $14.1B/$120.7B, 2023 $16.8B/$122.4B, 2024 $17.6B/$122.3B, 2025 $16.6B/$125.6B. FCF per the earnings releases and calls [31][32][33][34].
Reported FCF converts 12–14% of revenue and the trend is up from 11.7% in 2022, with one honest seam: 2024's 14.4% is flattered by ~$2.3 billion of DirecTV distributions, so on the like-for-like basis 2024 was closer to 12.5% and 2025's 13.2% is the higher of the two clean years [35]. Conversion is stable-to-improving, not eroding — which supports the reported-FCF-growth story that the reversion depends on. The FCF-stability question that anchors the year-10 durability test is developed in Durability; this tab's contribution is the adjusted-FCF reconstruction beneath it. The reservation the whole tab keeps returning to is not conversion or stability — it is that the capital intensity protecting the franchise, spectrum included, keeps adjusted owner earnings well below what the reported yield advertises.
Durability
AT&T is close to the shape the year-10 gate is built for. Four of the framework's five conviction sources apply cleanly and the fifth applies in part: a licensed-spectrum regulatory barrier, a roughly $260 billion network-and-spectrum asset base, a three-carrier wireless oligopoly, an essential product with 0.90% monthly churn, and a corporate history reaching to the 1984 Bell breakup. Revenue being higher in a decade is a very-high-conviction call. The genuine doubt the gate exposes sits on the cash leg — whether the same capital intensity that protects the franchise, against cable's accelerating encroachment on the wireless profit pool, lets adjusted free cash flow actually rise.
All figures are as-reported in U.S. dollars. Two perimeter changes matter for reading the trend charts: AT&T spun off WarnerMedia in April 2022 and deconsolidated DirecTV in 2021, so revenue and cash flow before 2022 describe a much larger company; and from 2025 management reports free cash flow excluding DirecTV. Where it affects a number, the text says so.
The conviction sources, one by one
Ruchir's year-10 conviction comes from five specific places. Graded honestly for AT&T — the reverse of an asset-light software name — four apply cleanly and one applies in part.
Sources: balance-sheet asset base and capex, FY2025 10-K [1]; FCC licensing regime, Item 1 Government Regulation [2]; wireless competitor structure, Item 1 Competition [3]; churn and subscriber base, MD&A [4]; history, Item 1 [5]. Three-carrier share is external, per prose below.
Capital intensity as moat — applies, and this is the strongest source. AT&T carries $131.6 billion of net property, plant and equipment and $128.1 billion of net spectrum licenses on a $420.2 billion balance sheet [6]. It spent $20.8 billion on capital expenditure in 2025 — 16.6% of revenue — the vast majority on the network [7]. The replacement cost of a national wireless-plus-fiber network and a matching spectrum portfolio is the barrier: a competitor cannot out-execute its way to a duplicate at reasonable cost. This is precisely the profile the framework says survives even when the business is not the best — capital-heavy essentials endure.
Net PP&E ($B)
Spectrum Licenses ($B)
2025 Capex ($B)
Net Debt ($B)
Net debt = long-term debt $127.1B + current maturities $9.0B − cash $18.2B. Source: FY2025 10-K Consolidated Balance Sheets [8]; capex per MD&A [9].
Regulatory entry barrier — applies. A facilities-based wireless provider "must be licensed by the FCC to provide communications services at specified spectrum frequencies within defined geographic areas," licenses run "typically 10 to 15 years," and the FCC has generally renewed them [10]. Spectrum is finite, auctioned, and held by incumbents — a new entrant cannot conjure it. The scarcity is visible in what incumbents pay to add to it: in August 2025 AT&T agreed to buy 600 MHz and 3.45 GHz licenses from EchoStar for approximately $23 billion [11]. This is the "the regulator does not let a garage startup take share" source the framework prizes for banks and insurers — and it applies as cleanly to licensed spectrum.
Market structure — applies. AT&T's own 10-K describes its wireless competitors as "two national wireless providers; a larger number of regional providers and resellers …; and certain cable companies" [12]. That is the three-carrier facilities-based oligopoly of AT&T, Verizon and T-Mobile, built on the Business tab. Publicly available industry data put the three carriers at essentially 100% of the U.S. postpaid market, with AT&T roughly 27% by subscribers versus T-Mobile in the mid-30s and Verizon in the mid-30s. AT&T's share has been stable-to-rising at the subscriber level: postpaid phone connections grew from 71.3 million in 2023 to 72.7 million in 2024 to 74.2 million in 2025 [13]. The qualifier: in broadband the structure is more contested — AT&T competes "with large cable companies and wireless broadband providers" [14] — so the oligopoly discipline is strongest in wireless, weaker in fixed.
Source: FY2025 10-K Mobility operating results [15].
Essential product — applies. Wireless connectivity is non-discretionary, and the evidence is the churn: postpaid phone churn was 0.90% a month in 2025, 0.76% in 2024 and 0.81% in 2023 [16] — under one customer in a hundred leaving each month. Households cut many things in a downturn before they cut the phone or the home internet, and AT&T's wireless base grew through 2020. Unlike a per-agent software licence, the demand is durable and the switching friction attaches partly to the vendor, not only the category.
Operating history — applies in part. AT&T was formed as SBC Communications and "spun-off from ATTC pursuant to an anti-trust consent decree" on January 1, 1984, "becoming an independent publicly traded telecommunications services provider" [17]. The corporate line and the network reach back to the Bell System; the entity has traded publicly for ~42 years and through every technology cycle since. The honest asterisk is that the portfolio is much younger than the ticker: the WarnerMedia and DirecTV exits of 2021-2022 reshaped AT&T back to a connectivity pure-play, so the long history is of the franchise and the network, less so of today's exact business mix.
The structural threats, hunted
The framework's instruction is to find the threat, quantify it, and state it plainly. Two are real and specific; one is a segment-level structural decline that is already visible.
Cable's wireless encroachment — the "your margin is my opportunity" threat. AT&T's 10-K names "certain cable companies" among its wireless competitors and warns that "our share of industry sales could be reduced due to aggressive pricing or promotional strategies pursued by competitors," with "pressure on pricing and margins" [18]. The scale of that encroachment is now visible in the cable operators' own filings. Comcast ended 2025 with 9.3 million Xfinity Mobile lines after adding 1.5 million during the year, all carried over Verizon's network as a mobile virtual network operator [19][20]. Charter's Spectrum Mobile passed 12 million lines in early 2026 [21], having added 1.9 million in 2025 [22]. Between them the two cable leaders added roughly 3.4 million wireless lines in a single year — more than twice AT&T's own 1.47 million postpaid phone net adds — sold as a cheap add-on to a broadband bundle, a low-cost model aimed squarely at the wireless profit pool that funds AT&T. The plausible year-10 impact is not that AT&T loses its base; it is a persistent drag on wireless service ARPU and on the industry's pricing power, exactly the margin pressure the 10-K flags. AT&T's counter is convergence — defending the wireless relationship by bundling it with its own fiber.
Sources: AT&T postpaid phone net adds (74.2M vs 72.7M), FY2025 10-K [23]; Comcast domestic wireless line adds, FY2025 10-K [24]; Charter mobile line adds, FY2025 10-K [25].
Legacy wireline — structural decline, present and stated (X3). The clearest structural decline in AT&T is in its legacy network. Business Wireline revenue fell 8.4% in 2025 to $17.2 billion, and within it the "legacy and other transitional services" line fell 17.4% [26]. Management attributes the fall to "industry-wide secular declines" [27] and is decommissioning its copper-based legacy network [28]. This is a genuine X3 pocket — but it is a shrinking minority of the company (Business Wireline is under 14% of revenue) being deliberately run off while Mobility and Consumer fiber grow. At the consolidated level, the structural-decline disqualifier is not triggered (next section); at the segment level, the decline is real and named.
Fixed-wireless and broadband substitution — two-sided. The technology shift toward 5G fixed-wireless home internet is dissolving the old cable-versus-telco broadband map. Cable is now losing broadband subscribers as fixed wireless (T-Mobile, Verizon) and fiber take share: Comcast alone shed 711,000 domestic broadband customers in 2025 [29]. For AT&T this cuts both ways: its own copper broadband is exposed, but AT&T is on the attacking side, adding fiber and its AT&T Internet Air fixed-wireless product against cable. It is not, on the current evidence, a net structural threat to AT&T the way it is to pure cable.
Is AI an Amazon-style substitution threat here? Searched, and no — the opposite. The 10-K expects "streaming, augmented reality, 'smart' technologies, user generated content and AI … to continue to drive greater demand for broadband," requiring continual network investment [30]. AI raises data demand across AT&T's network; it does not disintermediate the transport layer. The threat AI poses to AT&T is capital, not obsolescence — more traffic to carry, not a smaller market.
The disqualifier check — revenue trajectory
The framework's one mechanical disqualifier is revenue declining high-single-digit for three consecutive fiscal years after a long existence. The deterministic file cannot rule on it — fit_features.revenue_trajectory reports consecutive_decline_years = 0 and three_year_hsd_decline = false, but only because the income feed carried no annual revenue values (not_computable.revenue_trajectory = "no annual revenue values"). Rebuilt from the filed income statements, the flag genuinely reads false, with one honest complication.
Continuing-operations basis (excludes WarnerMedia, spun off April 2022). 2020-2022 per the FY2022 10-K [31]; 2023-2025 per the FY2025 10-K [32].
The complication is the perimeter. On an as-originally-reported basis, total operating revenues fell from $181.2 billion in 2019 to $171.8 billion in 2020 to $168.9 billion in 2021 [33], then to $120.7 billion in 2022 — a run that looks like a multi-year decline. It is not organic erosion: those steps are the DirecTV deconsolidation (2021) and the WarnerMedia spin-off (2022), divestitures of businesses AT&T chose to shed. On the like-for-like continuing-operations line, the year-over-year moves are −6.3% (2021), −9.9% (2022), +1.4% (2023), −0.1% (2024) and +2.7% (2025). The two decline years are consecutive but are not followed by a third; the last three years are flat-to-growing. The three-consecutive-year high-single-digit-decline disqualifier is not triggered (X3: checked, not present at the company level). What the trajectory shows instead is a business that finished reshaping itself smaller and has grown modestly since, led by Mobility (+5.0% in 2025) and consumer fiber.
FCF consistency — the P2 test
Ruchir's second durability test is that the rolling five-year average of adjusted FCF be stable and predictable. The deterministic file cannot compute it — fit_features.fcf_stability is empty and fit_features.adjusted_fcf.latest_adjusted is null, because stock-based compensation is missing for the early years and no complete five-year adjustment window exists (not_computable.fcf_stability, not_computable.adjusted_fcf). Reconstructed from management's reported free cash flow, the record is unusually steady for a business this size.
AT&T-defined free cash flow (cash from operations plus DirecTV distributions in investing, less capital expenditures and vendor-financing payments). 2022 $14.1B and 2023 $16.8B per the January 2024 earnings release [34]; 2024 $17.6B ($15.3B excluding DirecTV) per the Q4 2024 call [35]; 2025 $16.6B, excluding DirecTV, per the Q4 2025 call [36].
Reported free cash flow has sat in a $14–18 billion band every year since the WarnerMedia exit, has never gone negative, and grew "over $1 billion" in 2025 [37]. On the spirit of P2 — is the cash predictable, not merely large — this passes clearly. Two honest caveats. First, the series has definitional seams: 2024's $17.6 billion included ~$2.3 billion of DirecTV distributions that 2025 onward excludes, so on a like-for-like basis 2024 was $15.3 billion and 2025's $16.6 billion is the growth [38]. Second, the negative-episode carve-out the framework grants insurers and banks — a healthy loss every 5–8 years from an underwriting cycle — does not apply here; AT&T is not cyclical in that sense, and its FCF simply does not swing negative. The P2 caution is the opposite of volatility: the cash has been stable but range-bound, not compounding, because the capital intensity that anchors the moat also consumes the operating cash flow before it reaches free cash flow. Whether the number is materially higher in a decade is the year-10 question, taken up next; the adjusted-FCF reconstruction itself lives in Yield.
The year-10 case, both ways
The strongest case that year-10 revenue and adjusted FCF are higher. AT&T sells a non-discretionary service inside a three-carrier oligopoly, protected by an FCC spectrum-licensing regime a start-up cannot enter and a ~$260 billion network-and-spectrum asset base a competitor cannot cheaply replicate — the exact stack the framework says endures. Its postpaid phone base has grown three years running, churn is under 1% a month, and connectivity demand rises structurally as data and AI traffic grow. Reported free cash flow has held a tight $14–18 billion band with no negative years, and management guides it to over $18 billion in 2026, with adjusted EBITDA growth of 3% to 4% (improving to 5%-plus by 2028) as the fiber build peaks and depreciation falls [39]. On this evidence, year-10 revenue being higher than today's is a very-high-conviction call, and FCF higher is a reasonable one.
The strongest doubt. The doubt is narrow and it sits on the cash leg. The same capital intensity that is the moat is also a permanent claim on the cash: capex ran 16.6% of revenue in 2025, the EchoStar spectrum deal adds ~$23 billion, and ~$118 billion of net debt carries real interest cost — so free cash flow has been stable but flat, not rising, for years. Onto that, cable's low-cost wireless resellers are taking a growing share of industry net adds (roughly 39% in one recent quarter) and pressing on the wireless ARPU that funds the whole enterprise. A decade of that pressure, against relentless reinvestment needs, is a genuine reason to doubt that adjusted FCF — after stock compensation and spectrum/acquisition spend — is materially higher in year 10, even if the business is unmistakably still here and still large.
My read, stated once: the year-10 durability gate holds — revenue higher is very-high-conviction and reported FCF has been dependable enough that FCF higher is a defensible call, resting on the regulatory, capital-intensity, oligopoly and essentialness stack that this framework specifically trusts. The one reservation I will not round away is that the gate's cash leg is closer than its revenue leg: the moat's capital intensity and cable's structural encroachment make "adjusted FCF materially higher, with very high conviction" the part of the gate under real strain. What would change the read toward doubt: capex intensity failing to ease after the fiber build, wireless service ARPU rolling over under cable pressure, or FCF/EBITDA sliding where flat-to-up was underwritten — the same falsifiers the Yield and Self-Help tabs track.
Self-Help
AT&T can fund its own recovery. Net debt of about $117.9 billion sits at 2.53x adjusted EBITDA against a 3.75x covenant, with laddered maturities near $8–9 billion a year, $18.2 billion of cash and two undrawn multi-billion facilities [1] [2]. The buyback engine is real but young — token before 2025, then $4.5 billion in 2025 and roughly $10 billion planned for 2026 [3] [4]. The dividend was reset once, in 2022, and has held since. Share count is falling, not rising.
The balance sheet against the problem's duration
The dislocation here (Dislocation) is a valuation and fiber-ARPU worry, not a solvency scare — and the balance sheet is built to outlast it. At December 31, 2025, AT&T carried $136.1 billion of total long-term debt (including current maturities), of which $9.0 billion is current; the blended coupon is about 4.2%, and substantially all of it is unsecured [5]. Against $18.2 billion of cash, net debt is roughly $117.9 billion, which management reports at 2.53x adjusted EBITDA — below the 3.75x net-debt-to-EBITDA covenant in its credit agreements, and inside the "moderate" band of the framework's own leverage rule rather than the levered band [6] [7].
The maturity ladder is the reassuring part. No single year before 2031 requires more than about $9 billion, well inside the roughly $40 billion of annual operating cash flow and $16.6 billion of free cash flow the business throws off.
Source: FY2025 Annual Report (Form 10-K), Note 11 Debt, scheduled maturities table [8]. The final bar aggregates all maturities due 2031 and later.
The concentration sits in the "thereafter" stack — $106.2 billion, or about 78% of notes and debentures, matures 2031 or later, at a 4.3% weighted rate [9]. That is a long runway, but it also means refinancing is perpetual: AT&T issued $14.0 billion of new long-term debt in 2025 at about 5.0%, and another $6.5 billion in February 2026 at a 5.2% coupon [10]. Rolling 4.2% paper into 5%-plus paper lifts interest expense gradually — a headwind to free cash flow, not a threat to it.
Liquidity behind the ladder is deep. On November 3, 2025 AT&T put in place a $12.0 billion revolving credit agreement and a $17.5 billion delayed-draw term loan, neither drawn at year-end, and the company reports it was in compliance with all debt covenants [11]. The one wrinkle is the pending EchoStar spectrum purchase: management expects net leverage to rise to about 3.2x on close, then return to the 2.5x range within roughly three years [12]. That temporary step-up consumes flexibility that could otherwise front-load repurchases, but it stays inside the covenant and inside the moderate band. On the balance-sheet leg of self-help — can the company comfortably outlast the problem without capital allocation being forced toward debt paydown — the answer is yes: the deleveraging is essentially done, and cash is now free to move to shareholders.
The repurchase record — executed, not authorized
The record separates cleanly into two eras. From 2016 through 2024, buybacks were a rounding item — $0.2 to $0.9 billion in most years, with a single $5.5 billion burst in 2020 — while the dividend did all the returning. The share count did not shrink in this period; it rose, from 6.19 billion in 2016 to a peak of 7.59 billion in 2022, as the Time Warner and DirecTV-era transactions issued stock [13]. The buyback as a real capital-allocation pillar only began in 2025.
Source: cash-flow statements, FY2016–FY2025 10-Ks; FY2025 figure $4.5B [14]; series per fit_features.share_count_trend.buyback_cash_per_year.
Source: fit_features.share_count_trend; FY2025 shares of 7,179M per income.json and market-cap feature.
Two facts matter for the framework. First, the direction has turned: the share count has fallen from 7.59 billion (2022) to 7.18 billion (2025), a 5-year CAGR of about −0.8%, and the deterministic feature records rising = false — so the hard-fail condition, a share count climbing on stock-based compensation or serial M&A, does not apply today (fit_features.share_count_trend). Second, the engine is nascent and expensive to date: the 2025 repurchases retired about 168 million shares for $4.5 billion, an average of roughly $27.0 per share [15] — above today's $22.96. The buyback flywheel Ruchir looks for is only just starting to spin; it is not a decade-long habit like the levered precedents.
Management's buyback intent, from the record
Intent is where the recent record is strongest and most explicit. AT&T reached its 2.5x leverage target in mid-2025 and commenced repurchases under a $10 billion authorization, guiding to at least $3 billion completed by year-end [16]. On the Q4 2025 call CFO Pascal Desroches framed a three-year program: "we expect to return over $45 billion to shareholders during 2026 to 2028… we expect to maintain our current common stock dividend with a consistent pace of share repurchases through 2028, including approximately $8 billion of buybacks in 2026," with the Board authorizing an additional $10 billion beyond the current tranche [17].
By Q2 2026 the pace was raised. Desroches said AT&T would "further increase our pace of planned share repurchases this year by up to 25% to approximately $10 billion to capture what we see as a disparity between our operating fundamentals and the valuation of our stock" [18]. CEO John Stankey put it in valuation terms directly: "I'd like to buy more of it back because I think it's incredibly undervalued" [19]. This is exactly the price-sensitive, valuation-triggered repurchase intent the framework wants at a moment of maximum fear.
The counter-facts are worth stating plainly. The $10 billion raise is a pull-forward of buybacks already planned through 2028, not net-new capital — the $45 billion three-year envelope is unchanged. And Stankey deferred the ultimate allocation decision, not to himself but to the Board: "this Board will be deliberate. They'll spend some time in September, at their September meeting on this topic" [20]. Management has also declined to commit to a buyback floor when pressed. Intent is genuine and escalating; it is not yet locked in.
On the insider leg: there is no open-market buying alongside the corporate buyback. Every Form 4 transaction in the last cycle is an equity grant or award (SEC code A), not a purchase — including Stankey's — so directors and officers are accumulating stock through compensation, not adding conviction with their own cash (governance/insider_activity). That is common for a widely held mega-cap, but it is not the insider-buying signal that would strengthen the case.
The levered exception — does not apply
The framework tolerates real leverage only when the adjusted yield is massive (roughly 25%+) and a multi-year share-count reduction is already demonstrated and FCF and revenue are not deteriorating — all three legs, with numbers. AT&T meets none of the first leg's bar: the adjusted free-cash-flow yield cannot be computed from the feature file (adjusted FCF is not_computable — see Yield), but consensus forward free-cash-flow yield sits near 10–12% on current market cap, not 25%+ (fit_features.consensus_forward_yield). And the leverage itself, at 2.53x, is moderate, not levered. This is the default 10%-bar case, not the Charter-style levered path — so the levered exception is not the frame through which to read AT&T, and the yield question belongs to the ordinary bar in Yield.
The absurdity check
The deterministic float-retirement figure is not_computable because it requires positive adjusted FCF, which the feature file could not build (fit_features.float_retirement_years). Using reported free cash flow as the basis instead, the arithmetic is un-absurd: at a $164.8 billion market cap and $16.6 billion of 2025 free cash flow, it would take about 9.9 years of free cash flow to retire the entire float; on the 2026 guide of over $18 billion, about 9.1 years [21]. That is a stock priced at roughly ten times free cash flow — cheap for a durable oligopolist, but not the ~3-year figure that signals a price making a claim it cannot survive. The self-help math here is a steady grind, not a coiled spring.
Dividend safety
The dividend is a material part of the return — $1.11 per share against a $22.96 price is a 4.8% yield — so it earns a full look [22].
Coverage is comfortable. AT&T paid $8.18 billion in common and preferred dividends in 2025, against $16.6 billion of free cash flow — roughly 2.0x cover, and a payout of about half of free cash flow, leaving headroom for the buyback alongside [23]. Management's 2026 plan — about $18 billion of combined dividends and buybacks against an $18 billion-plus free-cash-flow guide — is essentially 100% of free cash flow, but the split (dividend fixed, buyback flexible) means a soft year pressures repurchases first, not the dividend [24].
The record through stress is the honest caveat. AT&T cut its dividend once, and recently: the payout was reset from $2.08 to $1.11 per share in 2022 — a 47% reduction — as part of the WarnerMedia separation, taking annual dividend cash from about $15.0 billion to $8.0 billion [25]. Since then it has held flat at $1.11 through 2023, 2024 and 2025, and management commits to "maintain our current common stock dividend… through 2028" [26]. So the base case for the dividend is safe — 2.0x covered, flat-to-held, explicitly prioritized over buybacks — but this is not a serial raiser with an unbroken record; it is a rebased payout three years into a hold. What would force a cut: free cash flow falling toward $12 billion or below while the deleveraging and spectrum bills still had to be paid, which the current $18 billion-plus guide leaves a wide margin against.
Net Debt ($B)
Net Debt / Adj. EBITDA
Dividend Yield
FCF / Dividend Cover
Sources: net debt derived from Note 11 debt of $136.1B less $18.2B cash [27]; 2.53x leverage and cash per Q4 2025 call [28]; dividend $1.11 on $22.96 and $8.18B paid vs $16.6B FCF [29].
Management credibility
Judged on promise-versus-delivery across the transcript archive, current management (Stankey and Desroches) reads as a keeper of controllable commitments rather than a promotional pattern. Five material promises from the 2023–2024 calls and their outcomes:
Source: earnings-call guidance ledger, Q3 2023–Q2 2026 (calls curation); FY2025 EPS/FCF actuals confirmed on the Q4 2025 call [30].
Four of the five landed; the miss was a Mobility EBITDA guide walked down mid-year, not a headline blow-up. Management telegraphed the one hard action it took — the 2022 dividend reset — well ahead of it, rather than defending an unsustainable payout, and the deleveraging promise that unlocked buybacks was hit on schedule. The blemishes are real but modest: a Q3 2025 deflection on CEO succession, no buyback floor when pressed, and no open-market insider buying to back the "incredibly undervalued" language.
The larger caution is corporate history, not current promises. The 2015 DirecTV (~$49 billion) and 2018 Time Warner (~$85 billion) acquisitions destroyed value, drove the share count up by roughly a fifth, and forced the 2022 dividend cut and the WarnerMedia unwind — a value-destruction record on the same board, executed by prior management. Stankey, who led the simplification, is the counter to that pattern rather than its author. On the framework's exclusion test — a promotional CEO with big claims, repeated misses and low skin in the game — AT&T does not trigger it: the numeric commitments have largely been met, the language is measured, and the one big reversal was owned rather than denied. It is a clean-enough record, with the dividend cut and the M&A history on the ledger as facts, not a promotional flag.
Clock
AT&T's discount is not an earnings trough waiting to inflect — the company is beating a low bar (Q2 2026 adjusted EPS up more than 20% year over year) while the stock fell about 31% from its September 2025 high. The re-rating levers are already turning: a buyback lifted to roughly $10 billion for 2026 to arbitrage the company's own undervaluation, capex intensity rolling toward mid-teens, and a board-authorized capital-return plan running through 2027–2028. Base rates say ~30% drawdowns are routine here; recovery from the trough has run 1.1 to 3.2 years.
The re-rating mechanism
The gap does not need a story to change — it needs three mechanisms already in motion to keep printing. None depends on a sentiment shift.
1. The buyback shrinking the denominator — management is arbitraging its own price. On the July 22, 2026 call, AT&T raised its planned 2026 repurchase pace by up to 25%, to approximately $10 billion, explicitly "to capture what we see as a disparity between our operating fundamentals and the valuation of our stock" [1]. At the current $164.8 billion market cap that is about 6% of the float retired in one year. In Q2 alone the company returned $4.1 billion, including roughly $2.2 billion of repurchases; buybacks plus dividends of about $18 billion for 2026 equal essentially 100% of the free-cash-flow outlook [2]. The three-year plan — over $45 billion returned across 2026–2028, "nearly 30% of our market cap and over 75% of our expected free cash flow" — carries board approvals to run repurchases through roughly the end of 2027, with an additional $10 billion authorization already in place [3] [4].
2. Cost and capex normalization. AT&T is retiring its legacy copper network — it has approval to discontinue legacy services in over 30% of wire centers, effective by late 2026, with a couple hundred wire centers expected to reach zero customers by year-end [5]. Management expects capital intensity to decline from a high-teens percent of revenue to the mid-teens as major fiber projects complete by 2030 or sooner, "driving higher durable long-term cash flow" — the same capex-roll-off pattern that resets a levered telecom's free cash flow [6].
3. Guidance resetting against a low bar, and a feared item de-risking. Full-year 2026 adjusted EPS is guided to $2.25–$2.35 against a company that printed $0.65 in Q2, up from $0.54; free cash flow is guided to $18 billion-plus, and management expects free cash flow "relatively stable year over year in the third quarter with strong year-over-year growth in the fourth quarter" [7]. The near-term overhang is leverage, not earnings: net debt/EBITDA of 2.68x will rise to roughly 3.2x when the EchoStar spectrum purchase closes (expected end of July 2026), then return to the ~2.5x target within about three years [8]. Deleveraging is the multi-year clock item; management states it can pursue it while sustaining the dividend and accelerating buybacks.
Sources: Q2 FY2026 earnings call [9] [10]; Q4 FY2025 earnings call [11]; earnings dates per consensus calendar.
Because the drawdown coincided with rising, not falling, earnings, the mechanism is a valuation-multiple normalization funded by the company's own cash return — closer to the telecom capex-decline pattern than to a healthcare forecasting-error snapback. The setup does not rest on an industry-wide repricing cycle; it rests on AT&T executing a return plan it has already funded and authorized.
Base rates from AT&T's own history
Thirty-six years of price history (dividend- and spin-adjusted, so recovery is measured on a total-return basis) show that a ~31% drawdown is unremarkable for this name. The current episode is at least the seventh peak-to-trough decline of 30%+ since 2007. The all-time high sits back in the 1999 telecom bubble and has never been revisited — a structural repricing of the whole sector — so the useful base rate is not "back to the record" but trough-to-recovery of the pre-drawdown high.
Source: derived from AT&T daily adjusted-close price history, 1990–2026 (dividend/spin-adjusted); episodes detected via a 20% swing filter. Company price feed, as reported.
Source: derived from AT&T daily adjusted-close history (total-return basis); blank recovery = prior high not yet reclaimed as of July 2026 (or episode ongoing). Company price feed, as reported.
Three readings the skeptic can recompute from the table:
- Depth is typical. The current −30.9% (September 15, 2025 high of $29.62 to the July 1, 2026 low of $20.48, per the run's capitulation gauge) sits in the middle of the pack — shallower than 2016–18 (−37%), COVID (−32%), and 2023 (−34%). The tape alone does not mark this as a franchise-breaking event.
- Trough-to-recovery has run 1.1 to 3.2 years in the three completed episodes since the 2021 top (2023 trough → prior high in ~14 months; 2022 → ~23 months; 2021 → ~38 months). The 2021–2023 stretch was one prolonged repricing — the WarnerMedia spin and the roughly 47% dividend reset in April 2022 — that delivered three of these legs in a row.
- Buying the peaks has repeatedly failed. The July 2016 high (−37%) and the November 2019 high (−32%) have still not been reclaimed on a total-return basis six-to-ten years on. That is the deserved-dislocation cautionary tale, and it belongs with the temporary-versus-permanent question the Damage Math trial decides — the base rate says fear-buying at the trough has paid, buying the top has not.
The current trough is only three weeks old; at $22.96 the stock is already about 12% above the July 1 low.
The 18-month test
Re-recognition within roughly 18–24 months is a reasonable expectation rather than a multi-year cycle-repair project, and three facts carry the read: the mechanism is company-funded and already authorized (a ~$10 billion 2026 buyback, board-approved through ~end-2027, against rising EPS), consensus forward free-cash-flow yield already clears the moderate bar and climbs through 2028 (below), and the three most recent completed drawdowns of this depth recovered on a total-return basis in 1.1 to 3.2 years from the trough — bracketing the window at its faster end. The read would be falsified if the mechanism fails to fire: free cash flow or EBITDA sliding below the guided $18 billion-plus / 3–4% path where flat-to-growth was underwritten, or capital allocation pivoting toward debt paydown over repurchases as leverage steps to 3.2x — the seeds the Fit tab publishes with thresholds. The one item that could push recovery past 24 months is the leverage overhang itself: if the market withholds a full multiple until net debt/EBITDA visibly returns toward 2.5x, that clock runs to ~2028–2029.
What consensus expects, and when
The sell side has not capitulated — which is the softer part of the fear signal. Of 26 covering analysts, 15 rate the stock buy or better, 10 hold, and 1 sell, essentially unchanged over three months; the mean price target of $29.03 sits about 26% above the $22.96 price, the median $29.25 (per consensus estimates, July 2026). Analysts already see the upside; the capitulation lives in the holder base and the tape (a 2.4x volume spike into the trough, per the Dislocation anatomy), not in the ratings. In Ruchir's frame that is the "buy side is merely scared" configuration rather than a sell-side washout.
Mean Target
Implied vs $22.96
Buy-rated (of 26)
Median Target
Source: consensus analyst targets and recommendation distribution, as of July 2026 (data feed, as reported).
The quarterly path shows the recovery is already in the print, not a hoped-for inflection. Adjusted EPS has beaten in five of the last six quarters, and the year-over-year growth rate stepped up sharply in the first half of 2026.
Source: reported adjusted EPS and consensus quarterly estimates; FY2026 full-year guide $2.25–$2.35 per Q2 FY2026 call [12].
For the cash story, the run's consensus free-cash-flow yields on the current market cap clear the moderate 10% reference line and rise each year — FY2026 about 11.0%, FY2027 about 11.7%, FY2028 about 12.9% — the configuration in which the sell side's numbers agree with a franchise the buy side has marked down.
Source: consensus FCF estimates on the current $164.8B market cap; derived in fit_features.consensus_forward_yield from data/sp/estimates.json. This is an unadjusted FCF yield — the SBC-adjusted "real" yield is computed in the Yield tab.
The candidate quarter for a printed re-rating is the fourth-quarter 2026 report, due late January 2027 — the period management itself flags for "strong year-over-year growth" in free cash flow, and the quarter that closes the full-year $18 billion-plus FCF and ~$10 billion buyback against a low prior-year base. The dividend, at roughly a 49% free-cash-flow payout in 2025 ($8.2 billion of dividends against $16.6 billion of FCF), leaves ample room for the buyback to run alongside it [13].
The instrument facts
Stated as facts, not as advice, and with no strikes, expiries, or sizing implied:
- Long-dated listed options exist. AT&T's expiration ladder runs through weeklies and monthlies out to LEAPS dated January 15, 2027, June 17, 2027, and January 21, 2028 — the last roughly 18 months out, satisfying the framework's ≥12-month (ideally 18+) reference.
- Liquidity is high. AT&T is among the more actively optioned US large-caps; a recent single session showed roughly 49,000 call and 13,000 put contracts traded, with deep open interest across the near-dated chain.
- Implied volatility sits comfortably below the elevated zone. Thirty-day implied volatility was about 27.7% on the calls (27.9% mean) as of July 23, 2026, per AlphaQuery — up from ~23% in February 2026, and well inside the up-to-~50–55 reference line, nowhere near the 60–70 "too high" band. January 2028 LEAPS carried implied volatility in the mid-20s in dated quotes.
By the framework's own logic, a name with qualifying long-dated options and a moderate implied-volatility level is expressible on the book rather than routed to a watchlist for want of instruments — a fact, not a recommendation. The volatility figures are cited to a dated source and are not estimated; the strike, expiry, and sizing questions the framework deliberately leaves unstated remain unstated here.